
Service Management
Behind every dashboard chart and every alert is a set of background services quietly doing the work: checking whether devices are reachable, polling them for metrics, and listening for the syslog and trap messages your equipment sends in. Service Management is where you see all of those services at a glance and confirm they’re healthy.
Open it from Configure → Service Management.
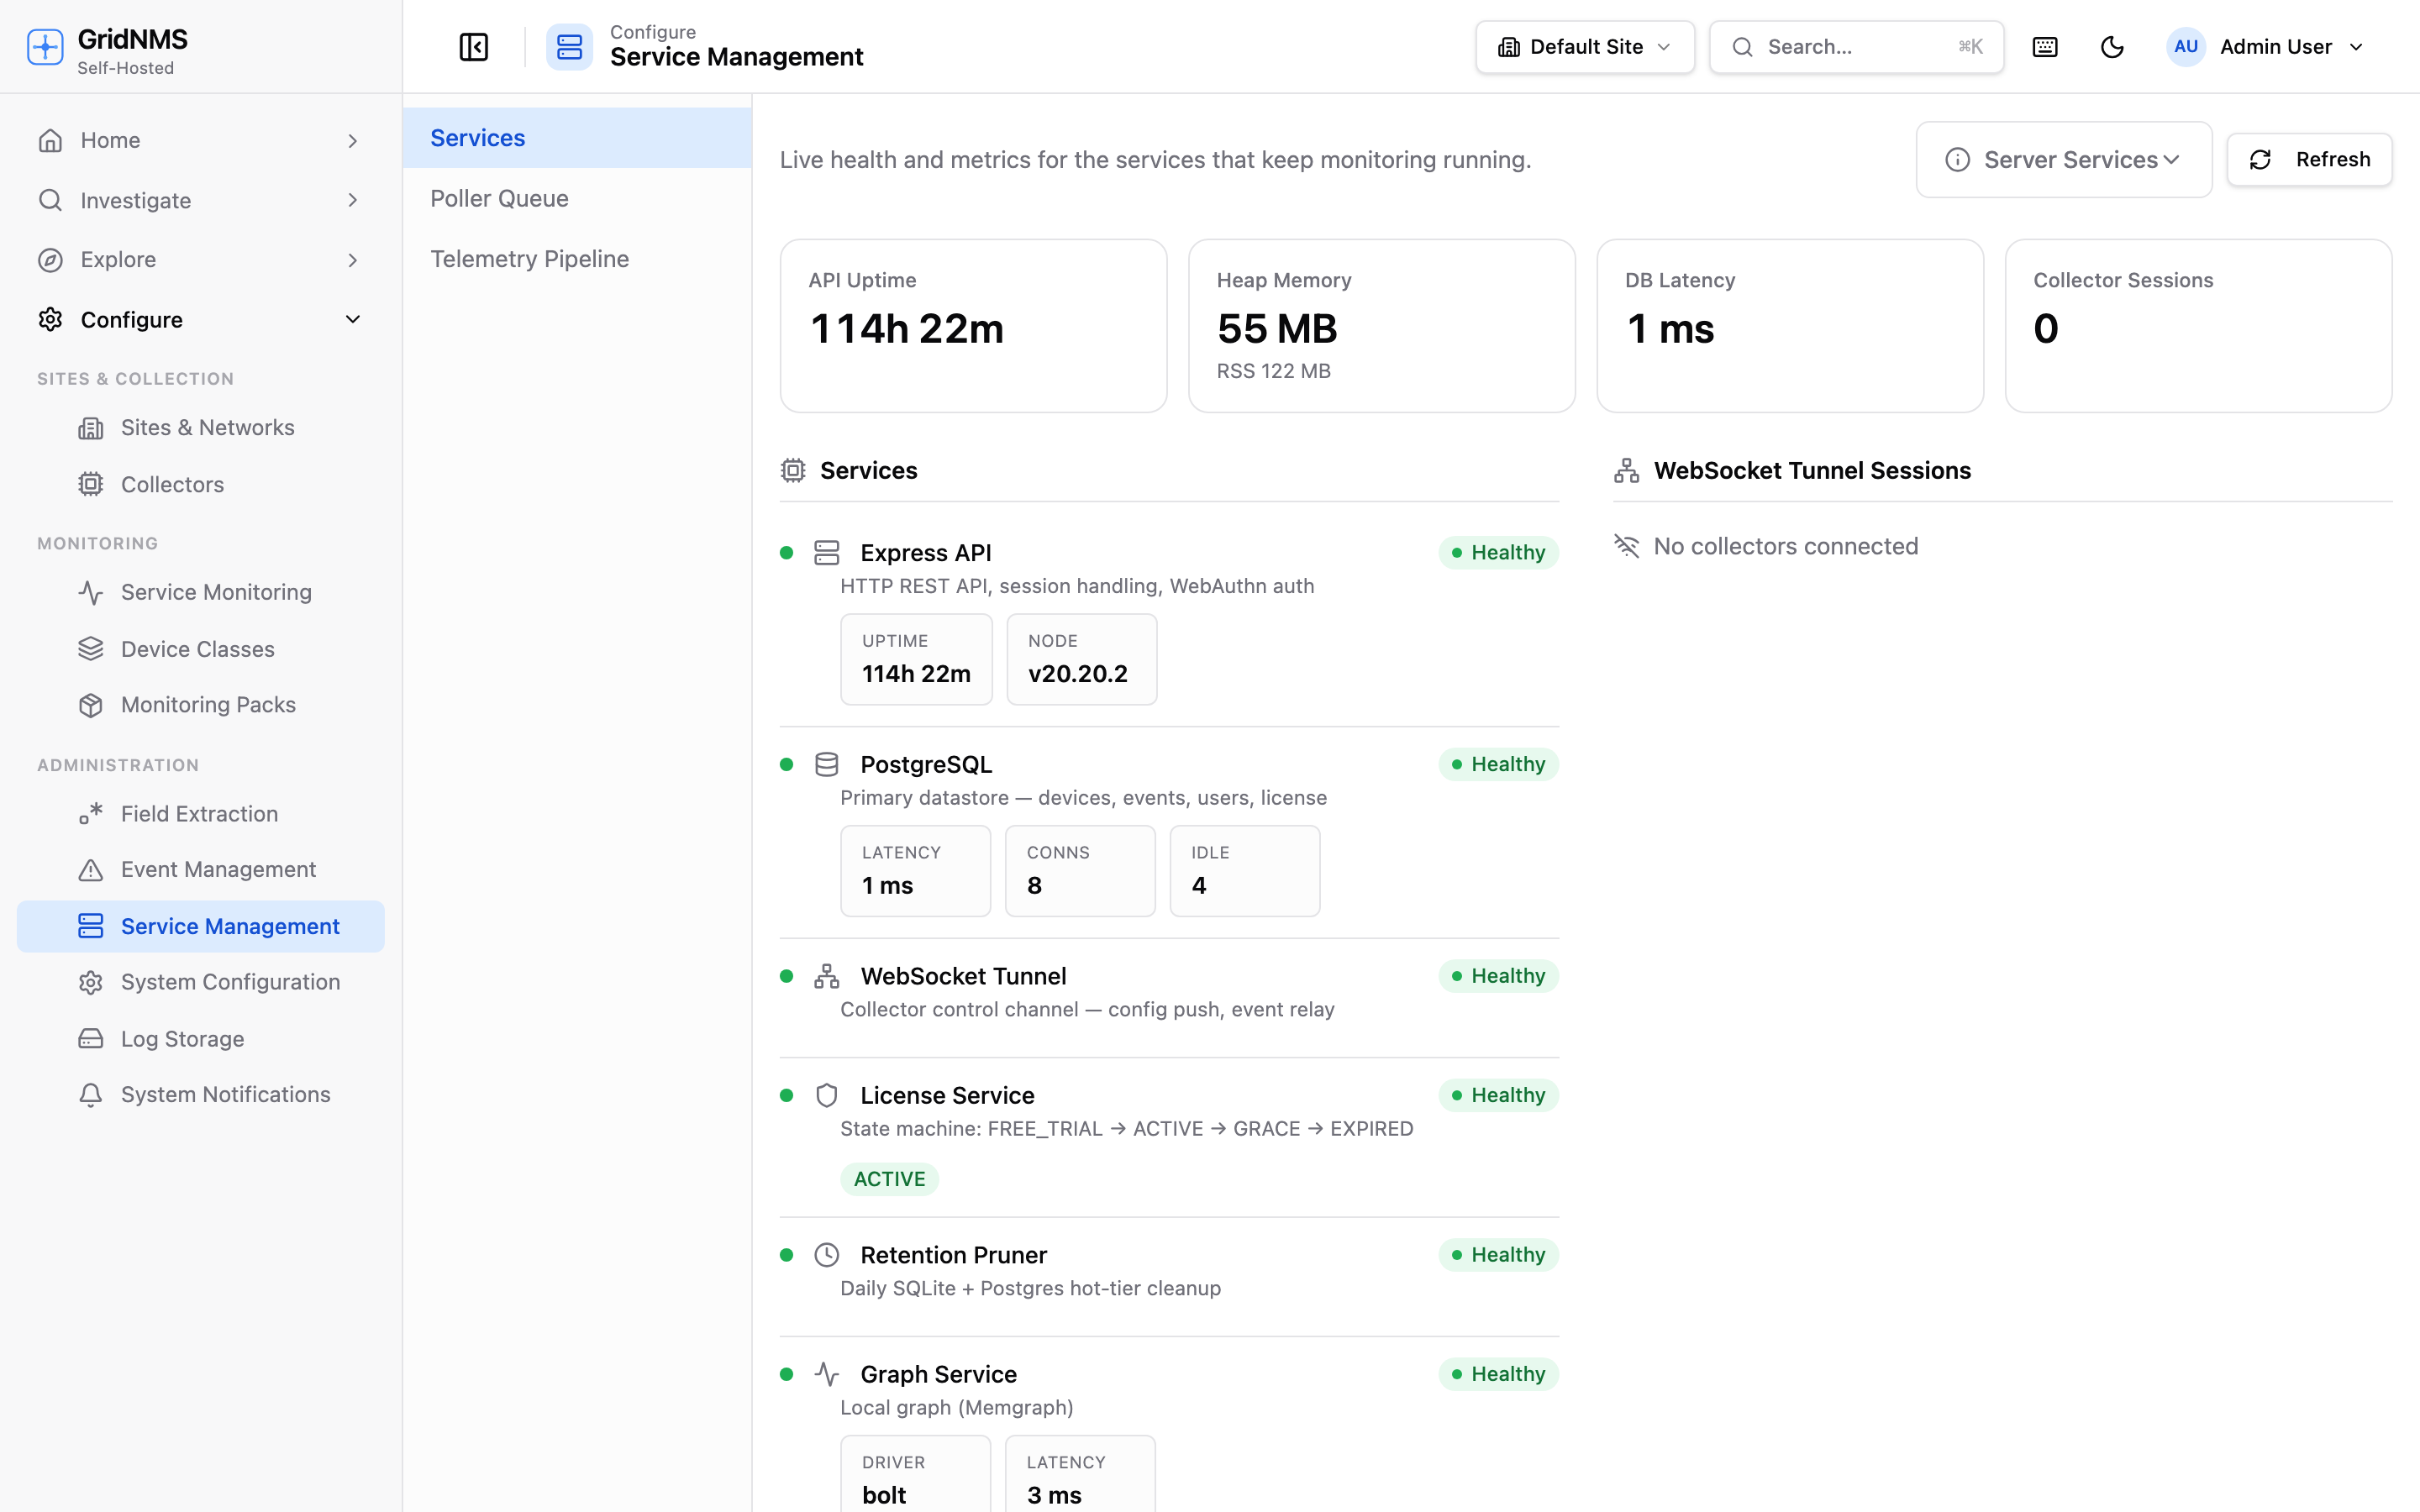 Service Management shows live health and uptime for each background service that keeps monitoring running.
What you’re looking at
Section titled “What you’re looking at”The page is split into a few areas:
- Overview chips across the top — quick headline numbers like how long the service has been running, current memory use, response time to the database, and how many collectors are connected right now.
- Services list — one row per background service, each with a status light and a few key details.
- Connected collectors — the collectors currently linked to GridNMS, with how long each has been connected.
- Trend charts — small line charts showing the last hour of memory, database response time, event volume, and connected-collector count, so you can spot a problem building up over time.
The page refreshes on its own every few seconds, and there is a Refresh button in the top-right if you want to force an immediate update.
The services and what they do
Section titled “The services and what they do”Each row in the services list represents one job GridNMS runs continuously. In plain terms:
| Service | What it does for you |
|---|---|
| Express API | Answers everything the GridNMS web app and your collectors ask for — loading pages, saving changes, signing in. If this is unhealthy, the app itself feels broken. |
| PostgreSQL | The main store for your devices, events, users, and settings. Its response time is the single best indicator of overall health. |
| Collector Management | The always-on link between GridNMS and every collector you’ve installed. It’s how configuration is pushed out and how collected data and events come back. |
| License Service | Tracks your subscription state and the limits that apply to your plan (for example, how many devices you can monitor). |
| Retention Pruner | Runs once a day to trim old, expired event history so storage doesn’t grow forever. |
| Graph Service | Powers the network map and the “what else is affected” blast-radius view. |
| Platform Connector (self-hosted) | The check-in that keeps your license, notices, and update availability current with the GridNMS platform. |
| Connector Realtime Pipe (self-hosted) | A realtime companion to the platform connection, used for faster delivery of updates and notices. |
Reading a service’s status
Section titled “Reading a service’s status”Every service row shows a coloured status indicator and a label:
- Healthy (green) — the service is running and responding normally. This is what you want to see across the board.
- Degraded (red) — the service responded, but something is wrong (for example, the database is slow or returning errors). Worth investigating.
- Unknown (grey) — GridNMS couldn’t determine the state, usually momentarily while it gathers a fresh reading. If a row stays grey, treat it like degraded.
Some rows expand to show extra detail. The database row, for example, shows its response time and how many connections are open; the licensing row shows your current plan state.
What healthy looks like
Section titled “What healthy looks like”On a well-running system you should expect:
- Every service row showing Healthy.
- Database response time steady and low (typically a few milliseconds), with a flat trend line rather than a climbing one.
- A steady, expected number of connected collectors — matching the collectors you actually installed.
- The event-volume chart tracking your normal traffic, not spiking to zero (which can mean data has stopped flowing) or far above normal (which can mean a storm).
What to do when something looks wrong
Section titled “What to do when something looks wrong”This page is a monitoring view — it tells you what’s healthy and what isn’t, so you know where to focus, rather than something you take action from directly.
- A service shows Degraded and stays that way after a couple of refreshes — worth investigating rather than a one-off blip.
- The web app is sluggish or erroring and the database response-time chart is climbing steadily — the database is the likely bottleneck.
- A collector shows as connected here but isn’t sending any data — see Monitoring Your Collectors for how to dig into that specific collector.
Reading the live activity
Section titled “Reading the live activity”The trend charts at the bottom act as a short-term flight recorder for the last hour. Use them to tell a one-off blip from a real trend:
- Memory climbing without ever falling can indicate a service that needs a restart.
- Database response time spiking and staying high points at a database under pressure — slow queries, too much load, or a storage problem underneath.
- Event volume dropping to nothing usually means data stopped arriving — check your collectors next.
- Connected collectors dropping unexpectedly means one or more collectors lost their link.
Typical scenarios
Section titled “Typical scenarios”“The web app is slow for everyone.” Check the database row and its response-time chart first. If response time is high and climbing, the database is the bottleneck — that points to deeper investigation rather than something else on this page.
“Charts and alerts stopped updating.” Look at the connected-collectors count and the event-volume chart. If collectors dropped off or event volume fell to zero, the issue is almost certainly on the collector side rather than here.
“One service is stuck on Degraded.” Refresh once or twice to rule out a momentary reading. If it persists, that service — and whatever it depends on — is where to focus.
Where to go next
Section titled “Where to go next”- Monitoring Your Collectors — health of each collector’s own reachability, polling, and log-receiving jobs.
- Poller Queue — see the queue of pending device polls and which collector is handling each.
- Troubleshooting — step-by-step help when something isn’t behaving as expected.
docs built 2026-09-26 · 195c6d00