
Reading a Collector's Health Tab
Every collector reports detailed live status back to GridNMS — what it’s running, its resource usage over time, and a set of pipeline statistics for diagnosing log and metric delivery. You’ll find all of it in one place.
Go to Configure → Collectors, open a collector from the list, and select its Health tab.
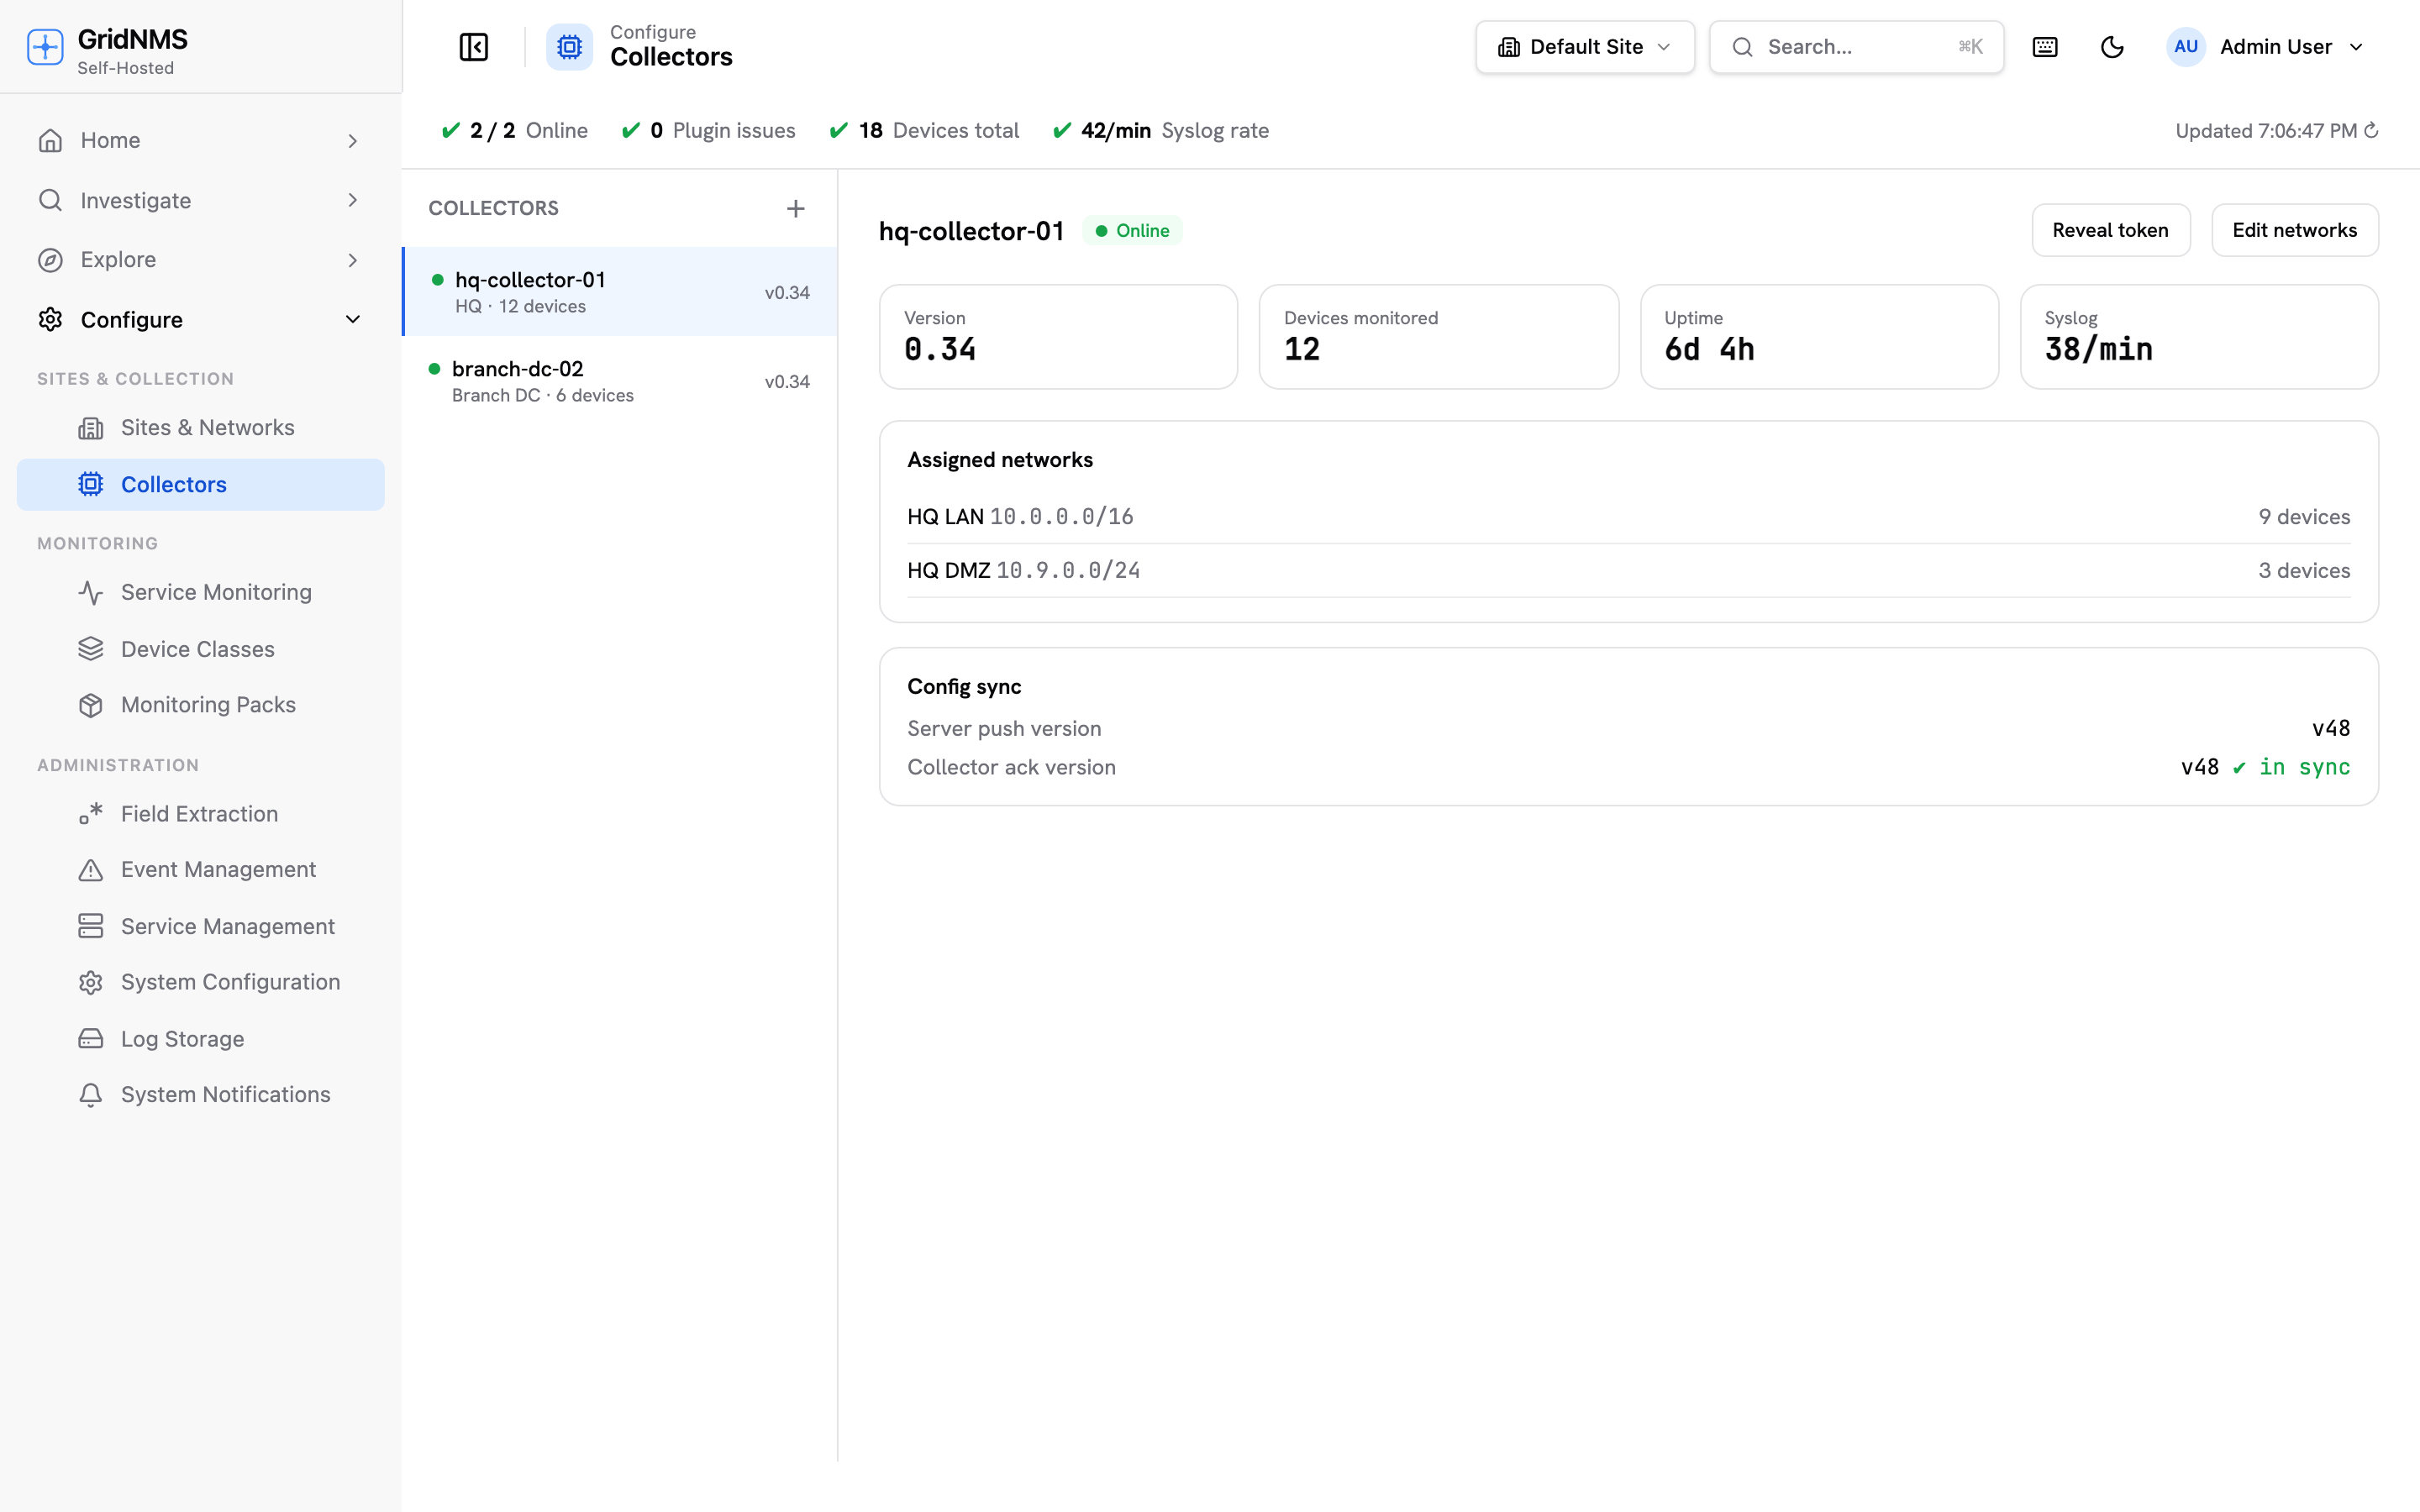 The Collectors page. Open a collector and its Health tab shows the detail on this page.
Plugin status
Section titled “Plugin status”A collector runs several workers, each shown as a chip at the top of the Health tab:
| Plugin | What it does |
|---|---|
| Monitor | Liveness checks — is each device up? |
| Poller | Collects metrics and details from devices. |
| Syslog | Receives syslog messages from devices. |
| SNMP Traps | Receives SNMP traps from devices. |
| Service Monitoring | Synthetic HTTP / DNS / SMTP / SMB checks. |
| Discovery | Active network discovery scans (on-demand, not continuous). |
Each chip shows whether that worker is enabled or disabled (turned on/off under the collector’s Settings tab), and — when the collector reports live status — whether it’s confirmed Running. A worker that isn’t currently doing anything (for example, the trap listener when nothing is sending traps) simply reads enabled without a green confirmation; that’s normal, not a problem.
Metrics history
Section titled “Metrics history”Recent history for the collector host’s own resource usage:
| Chart | What it shows |
|---|---|
| Memory | Memory used by the collector process, in MB. |
| CPU | CPU usage, as a percentage. |
| Disk used | Disk space used by the collector’s local queue and state, in GB. |
| Devices monitored | How many devices this collector currently owns for active polling — see Collector Profiles for how ownership is decided. |
Pick a time range (1h / 6h / 24h / 7d) above the charts. A brand-new collector has no history for its first few minutes — that’s expected while its first heartbeats accumulate.
Pipeline stats
Section titled “Pipeline stats”Below the resource charts, a set of cards show what’s actually flowing through the collector:
- Metrics relay — if you run Log Forwarders pointed at this collector, they send their own host metrics (CPU, memory, disk) through it rather than straight to GridNMS. This card shows whether that relay is listening and how many metric batches it’s received (and rejected, if any).
- Log ingest — a history chart of how many log events this collector has received in the selected time range. If nothing has come through, the card says so plainly rather than showing a flat, misleading zero line.
- Metric-write drops — samples that couldn’t be stored. Occasional drops during a burst aren’t unusual; a sustained climb is worth investigating.
- Backlog / queue depth — how many events are waiting to be sent onward. Zero is ideal; a number that keeps climbing means the collector is receiving faster than it can ship, the same signal described in Monitoring & Managing Collectors.
Related pages
Section titled “Related pages”- Monitoring & Managing Collectors — the fleet-wide view and first steps when something’s wrong.
- Collector Profiles — how GridNMS decides which collector actively polls a device.
- Logs & Log Search — find and search the logs once they arrive.
docs built 2026-09-26 · 195c6d00