
Detections
Searching your logs is reactive — you only find a problem when you go looking. Detections make it proactive. A detection is a rule that continuously watches your incoming logs and automatically raises an event the moment a message matches a pattern you care about. Instead of remembering to search for “failed password” every morning, you write the rule once and GridNMS tells you when it happens.
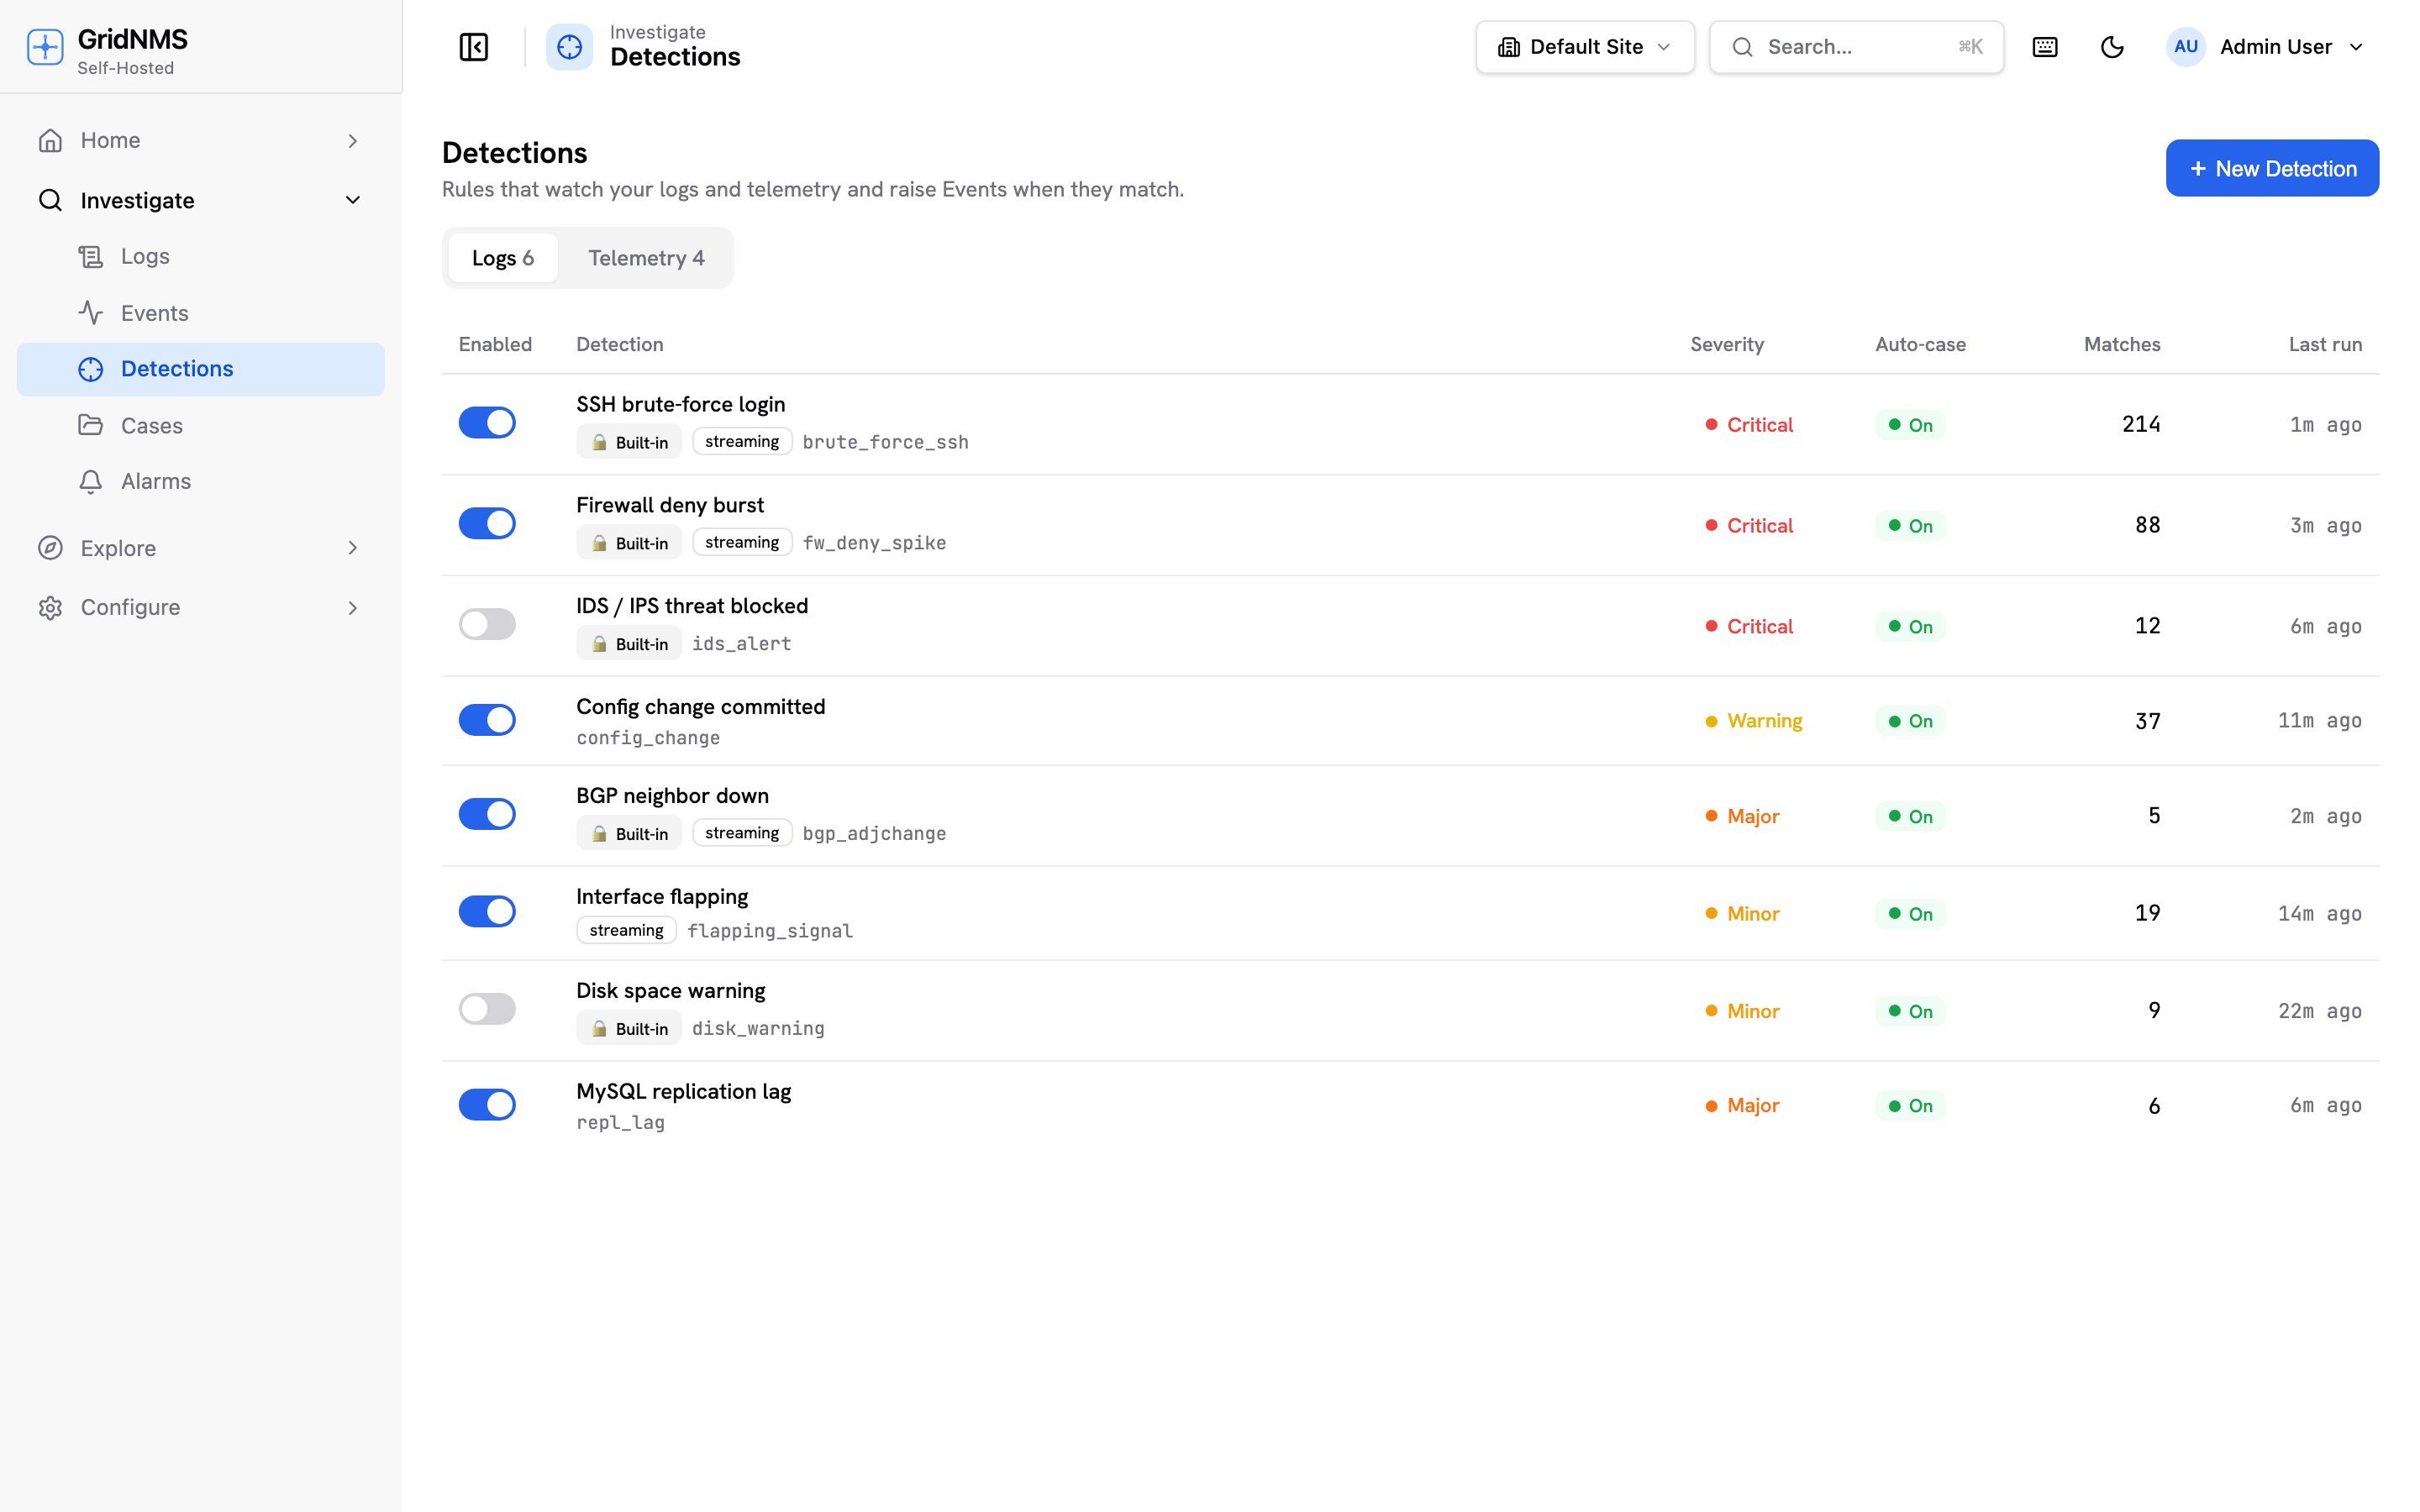 The Detections page lists each rule with its on/off switch, severity, match count, and when it last ran.
What a detection does
Section titled “What a detection does”A detection describes:
- What to look for in incoming logs (for example, many failed logins from the same address in a short window).
- How serious a match is — its severity.
- What to do on a match — always raise an event, and optionally open a Case.
When the rule matches, GridNMS raises an event on the Events & Alerts page, exactly like any other alert. To be told when it fires, turn on Notify on match right on the detection and pick who to alert — see Notifications.
Where to find it
Section titled “Where to find it”Open Configure → Logs and Events and select the Detections tab. Rules are split across three tabs by what they watch — Logs, Telemetry, and System (see System detections below) — and each tab can be filtered to All, Custom, or Built-in. The list shows every rule with:
| Column | What it tells you |
|---|---|
| Enabled | A switch to turn the rule on or off without deleting it. |
| Detection | The rule’s name and description; built-in rules are marked, and any with a recent error are flagged. |
| Severity | How serious a match is. |
| Priority | Which rule wins when several could match the same thing — see When two rules match. Auto means GridNMS works it out for you. |
| Auto-case | Whether a match also opens a Case. |
| Matches | How many times the rule has matched. |
| Last run | When it last evaluated your logs. |
Click any row to open its editor.
Built-in starter rules
Section titled “Built-in starter rules”GridNMS ships with several built-in detections so you get value on day one, covering common security and operational patterns such as:
- Authentication failures — repeated failed logins that may indicate a brute-force attempt.
- Privilege or configuration changes — someone gaining elevated access or altering device configuration.
- Suspicious or service-related activity reported in your logs.
Built-in rules are marked as such. You can enable or disable them and adjust their settings, but you can’t delete them — they’re always available to switch back on. Start by reviewing these, turning on the ones that fit your environment.
System detections
Section titled “System detections”The System tab holds a third kind of rule: notifications for things GridNMS itself notices about your account and your infrastructure, rather than patterns it looks for in your logs or telemetry.
These are not rules you write. There is no New Detection button on this tab, and there is no query to edit — GridNMS decides when each one fires. What you control is whether it notifies you and who it reaches: open a row and set its notification endpoints and recipients exactly as you would for any other detection, then use the Enabled switch to turn it on or off.
| Detection | Fires when | On by default |
|---|---|---|
| Storage quota warning (80%) | Your log storage reaches 80% of your plan’s allowance. | Yes |
| Storage quota warning (95%) | Your log storage reaches 95% of your plan’s allowance. | Yes |
| Cloud connector unreachable | A self-hosted instance stops reaching GridNMS — so licensing, reference data, and release notices are no longer arriving. | Yes |
| Managed service down | A service you’ve modelled in Service Monitoring goes down. | No |
| Managed service degraded | A modelled service drops to degraded. | No |
| Collector agent heartbeat lost | A collector stops checking in, so it is no longer collecting. | No |
| Collector local address changed | A collector reports a different local address than before — usually a moved or re-addressed host. | No |
Service recoveries are handled for you: when a service comes back, GridNMS clears the corresponding alert without a second rule to configure.
This is the tab to open when you want to know why a storage-quota email arrived, or to send service-down alerts somewhere other than the default.
Creating or editing a rule
Section titled “Creating or editing a rule”Click New Detection (or click an existing rule) to open the editor.
- Title — a name you’ll recognize, e.g. SSH brute force.
- Severity — Critical, Major, Minor, Warning, or Info. This becomes the severity of the events the rule raises.
- Description — a short note on what the rule detects.
- Rule — the pattern itself (covered below). Use Test to check it before saving.
- Enabled — whether the rule is active.
- Open a Case on match — turn this on to have matches also create a Case, so a meaningful pattern becomes a ready-made investigation rather than just an event.
- Notify on match — turn this on to be alerted when the rule fires. Choose Notify me and/or pick one or more notification endpoints (email, Slack, webhook, PagerDuty) from the dropdown. This is how a detection pages people — there’s no separate subscriptions list to maintain.
- Auto-clear (for problem detections) — give the rule a recovery condition and GridNMS automatically raises the matching recovery event when the problem clears, so a resolved issue shows up in the feed without you having to notice and report it yourself.
Click Save to store the rule. On an existing rule, Run now evaluates it immediately against recent logs so you can confirm it behaves as expected, and shows how many matches it found.
Scheduled vs. streaming
Section titled “Scheduled vs. streaming”A detection runs in one of two ways:
| Mode | How it runs | Best for |
|---|---|---|
| Scheduled (default) | The rule re-checks your logs on a timer — you set Run every in seconds. | Rules that count activity over a window, like “10 failed logins in 5 minutes.” |
| Streaming | The rule is evaluated as each log arrives, not on a timer. | Catching a single, unambiguous bad line the instant it lands. |
Turn on the Streaming switch for a rule when you want an immediate reaction. Leave it off and set an interval when the rule needs to look across a window of recent activity.
When two rules match
Section titled “When two rules match”Streaming and telemetry rules are evaluated most specific first, and stop at the first one that matches — so a single log line or measurement raises one event from the rule that fits it best, not one event per matching rule. A narrowly targeted rule beats a broad catch-all.
GridNMS works the order out from how specifically each rule is written, which is what Priority: Auto in the list means. Set Priority explicitly on a rule (higher wins) when you want to override that — typically to make a catch-all defer to a rule you’ve just written, or to force one rule ahead of another that keeps claiming the match.
Scheduled rules are the exception: they all evaluate independently over their own window, so several can match the same activity and each raises its own event.
Testing a rule
Section titled “Testing a rule”Before you save, click Test. GridNMS checks that the rule is valid and does a dry run against your current logs, reporting:
- Whether the rule parsed correctly (you’ll see a clear error if not).
- The window, threshold, and grouping it compiled to.
- How many matches it found right now, with a few examples.
If the test shows zero matches when you expected some, widen the window or loosen the pattern; if it shows far too many, tighten it. Iterate here until it’s right, then enable it.
What happens on a match
Section titled “What happens on a match”- The rule matches one or more incoming log messages.
- GridNMS raises an event at the rule’s severity on the Events & Alerts page.
- If Open a Case on match is on, the event is also rolled into a Case for investigation.
- If Notify on match is on, the event is delivered to you and/or the notification endpoints you chose on the detection.
The Matches count and Last run time on the list update so you can see at a glance which rules are firing and which are quiet.
Sharpening detections with extracted fields
Section titled “Sharpening detections with extracted fields”Detections are far more precise when your logs have named fields to match on — like a source IP, a username, or an outcome — rather than raw text. That’s what Field Extraction provides: it pulls structured fields out of messy log lines so a detection can say “group by source IP and fire when one address fails 10 times” instead of fuzzy text matching. GridNMS extracts common fields automatically, and you can add your own for gear-specific formats.
Where to go next
Section titled “Where to go next”- Find the log lines to build rules from in Logs & Log Search.
- Make rules sharper with Field Extraction.
- See the fields available to match on in The Log Data Model and the full Writing Rules reference.
- Turn matches into investigations with Cases.
- Review the events your rules raise on Events & Alerts.
docs built 2026-09-26 · 195c6d00