
Monitoring
Monitoring is what GridNMS does around the clock so you don’t have to. It checks that your devices are reachable, collects detailed metrics like traffic and CPU, and watches those metrics against thresholds you set — raising an event the moment something looks wrong. This page covers what gets monitored, how to read the data, and how to set up bandwidth thresholds.
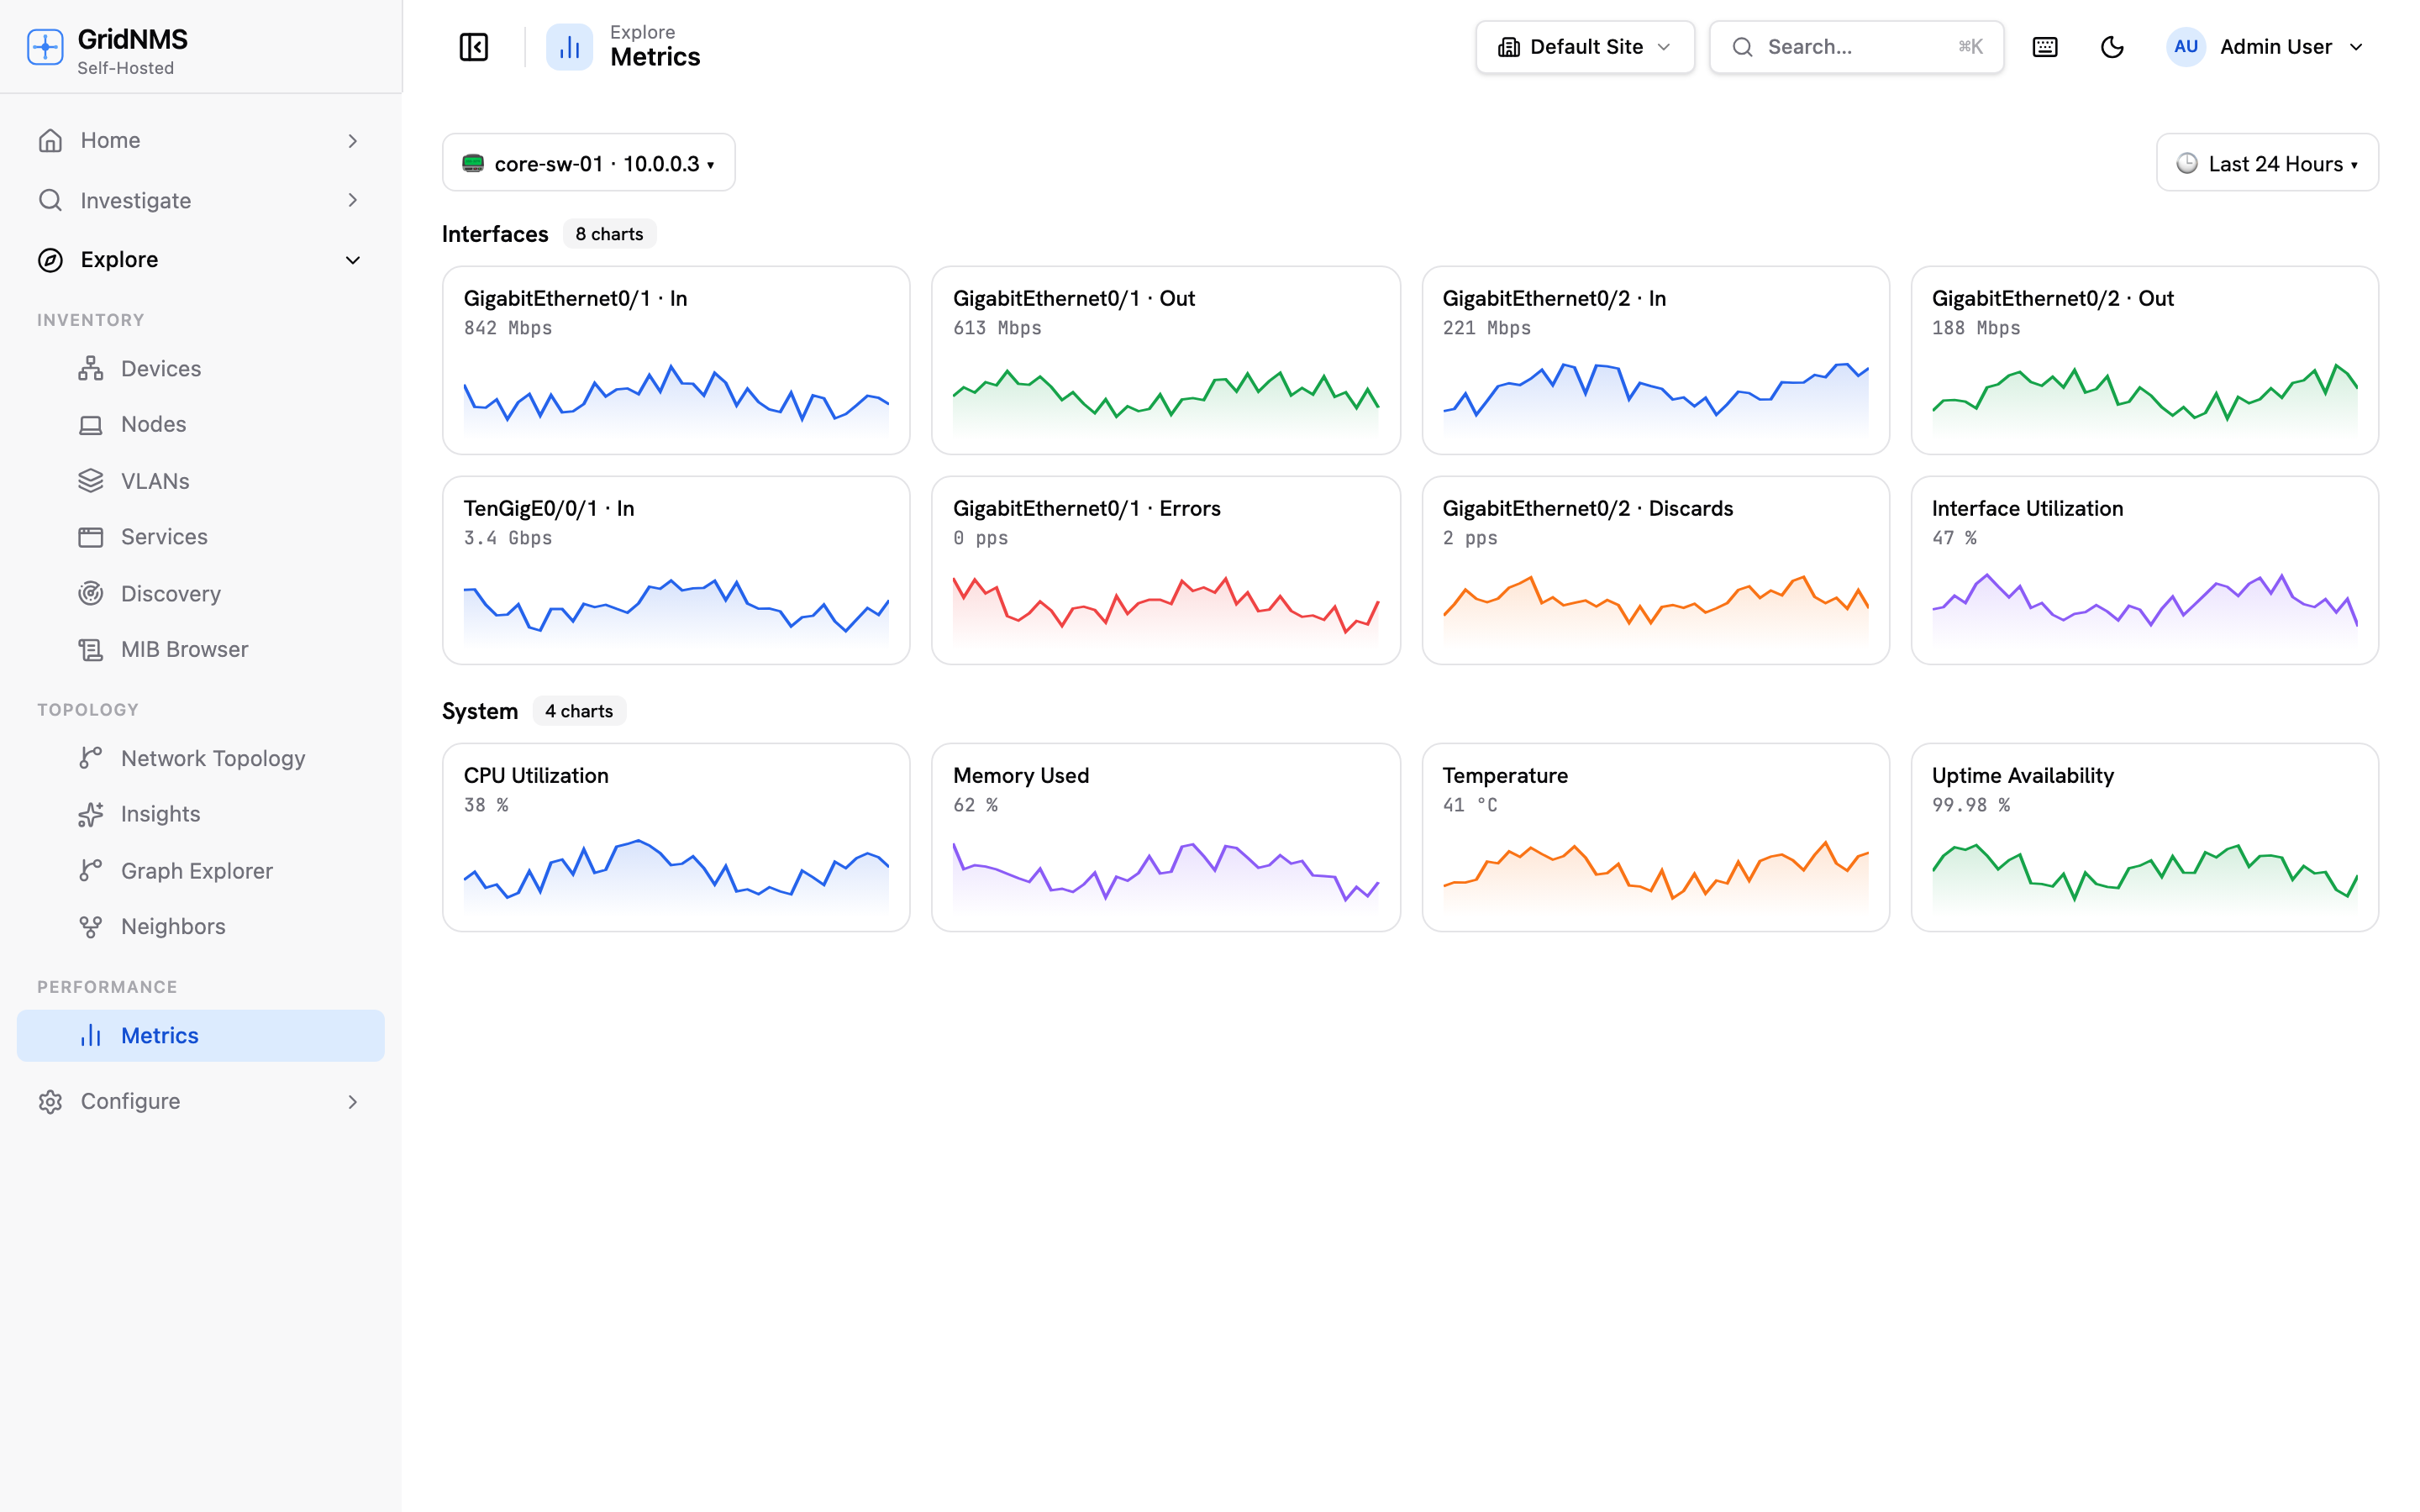 Device Metrics lets you pick a device and metric, choose a time range, and read the charts.
Two kinds of monitoring
Section titled “Two kinds of monitoring”GridNMS watches your devices in two layers:
- Reachability checks — a regular “are you alive?” test of each device. This is what drives the Up / Down / Unknown status you see everywhere. A device that stops responding is marked Down and raises an event.
- Metric collection — periodic gathering of detailed numbers from each device: interface traffic, CPU load, memory use, disk capacity, temperatures, and more, depending on what the device exposes.
For a deeper look at the mechanics, see How Monitoring Works.
Monitoring packs
Section titled “Monitoring packs”You don’t configure each metric by hand. Instead, GridNMS uses monitoring packs — bundles of checks that are attached to a device class. When you set a device’s class (Router, Switch, Firewall, Access Point, and so on), it automatically inherits the right pack and starts collecting the metrics that make sense for that kind of device.
Because packs attach to classes and classes form a hierarchy, monitoring “just works” once a device has the correct class. A switch gets interface and port metrics; a server-style device gets CPU, memory, and disk; a wireless controller gets client and radio metrics — all without per-device setup.
The Device Metrics page
Section titled “The Device Metrics page”Open Explore → Device Metrics to explore the numbers GridNMS has collected.
- Select a device — start typing its name or pick it from the list.
- Select a metric — for example, an interface’s inbound/outbound traffic, CPU utilization, or memory usage.
- Choose a time range — use the time-range picker to switch between the last hour, last day, last week, or a custom window.
- Read the chart — the line chart plots the metric over your chosen range.
Reading the charts
Section titled “Reading the charts”- Time runs left to right. The most recent data is on the right edge.
- Hover over the line to see the exact value at a point in time.
- Traffic is usually shown in bits per second (e.g. Mbps); utilization metrics (CPU, memory, disk) are shown as a percentage.
- Gaps in a line mean GridNMS didn’t have data for that period — often because the device was unreachable or monitoring was paused.
Interface bandwidth thresholds
Section titled “Interface bandwidth thresholds”Beyond just graphing traffic, GridNMS can alert you when an interface crosses a bandwidth level you care about. This is how you find saturated uplinks before users start complaining.
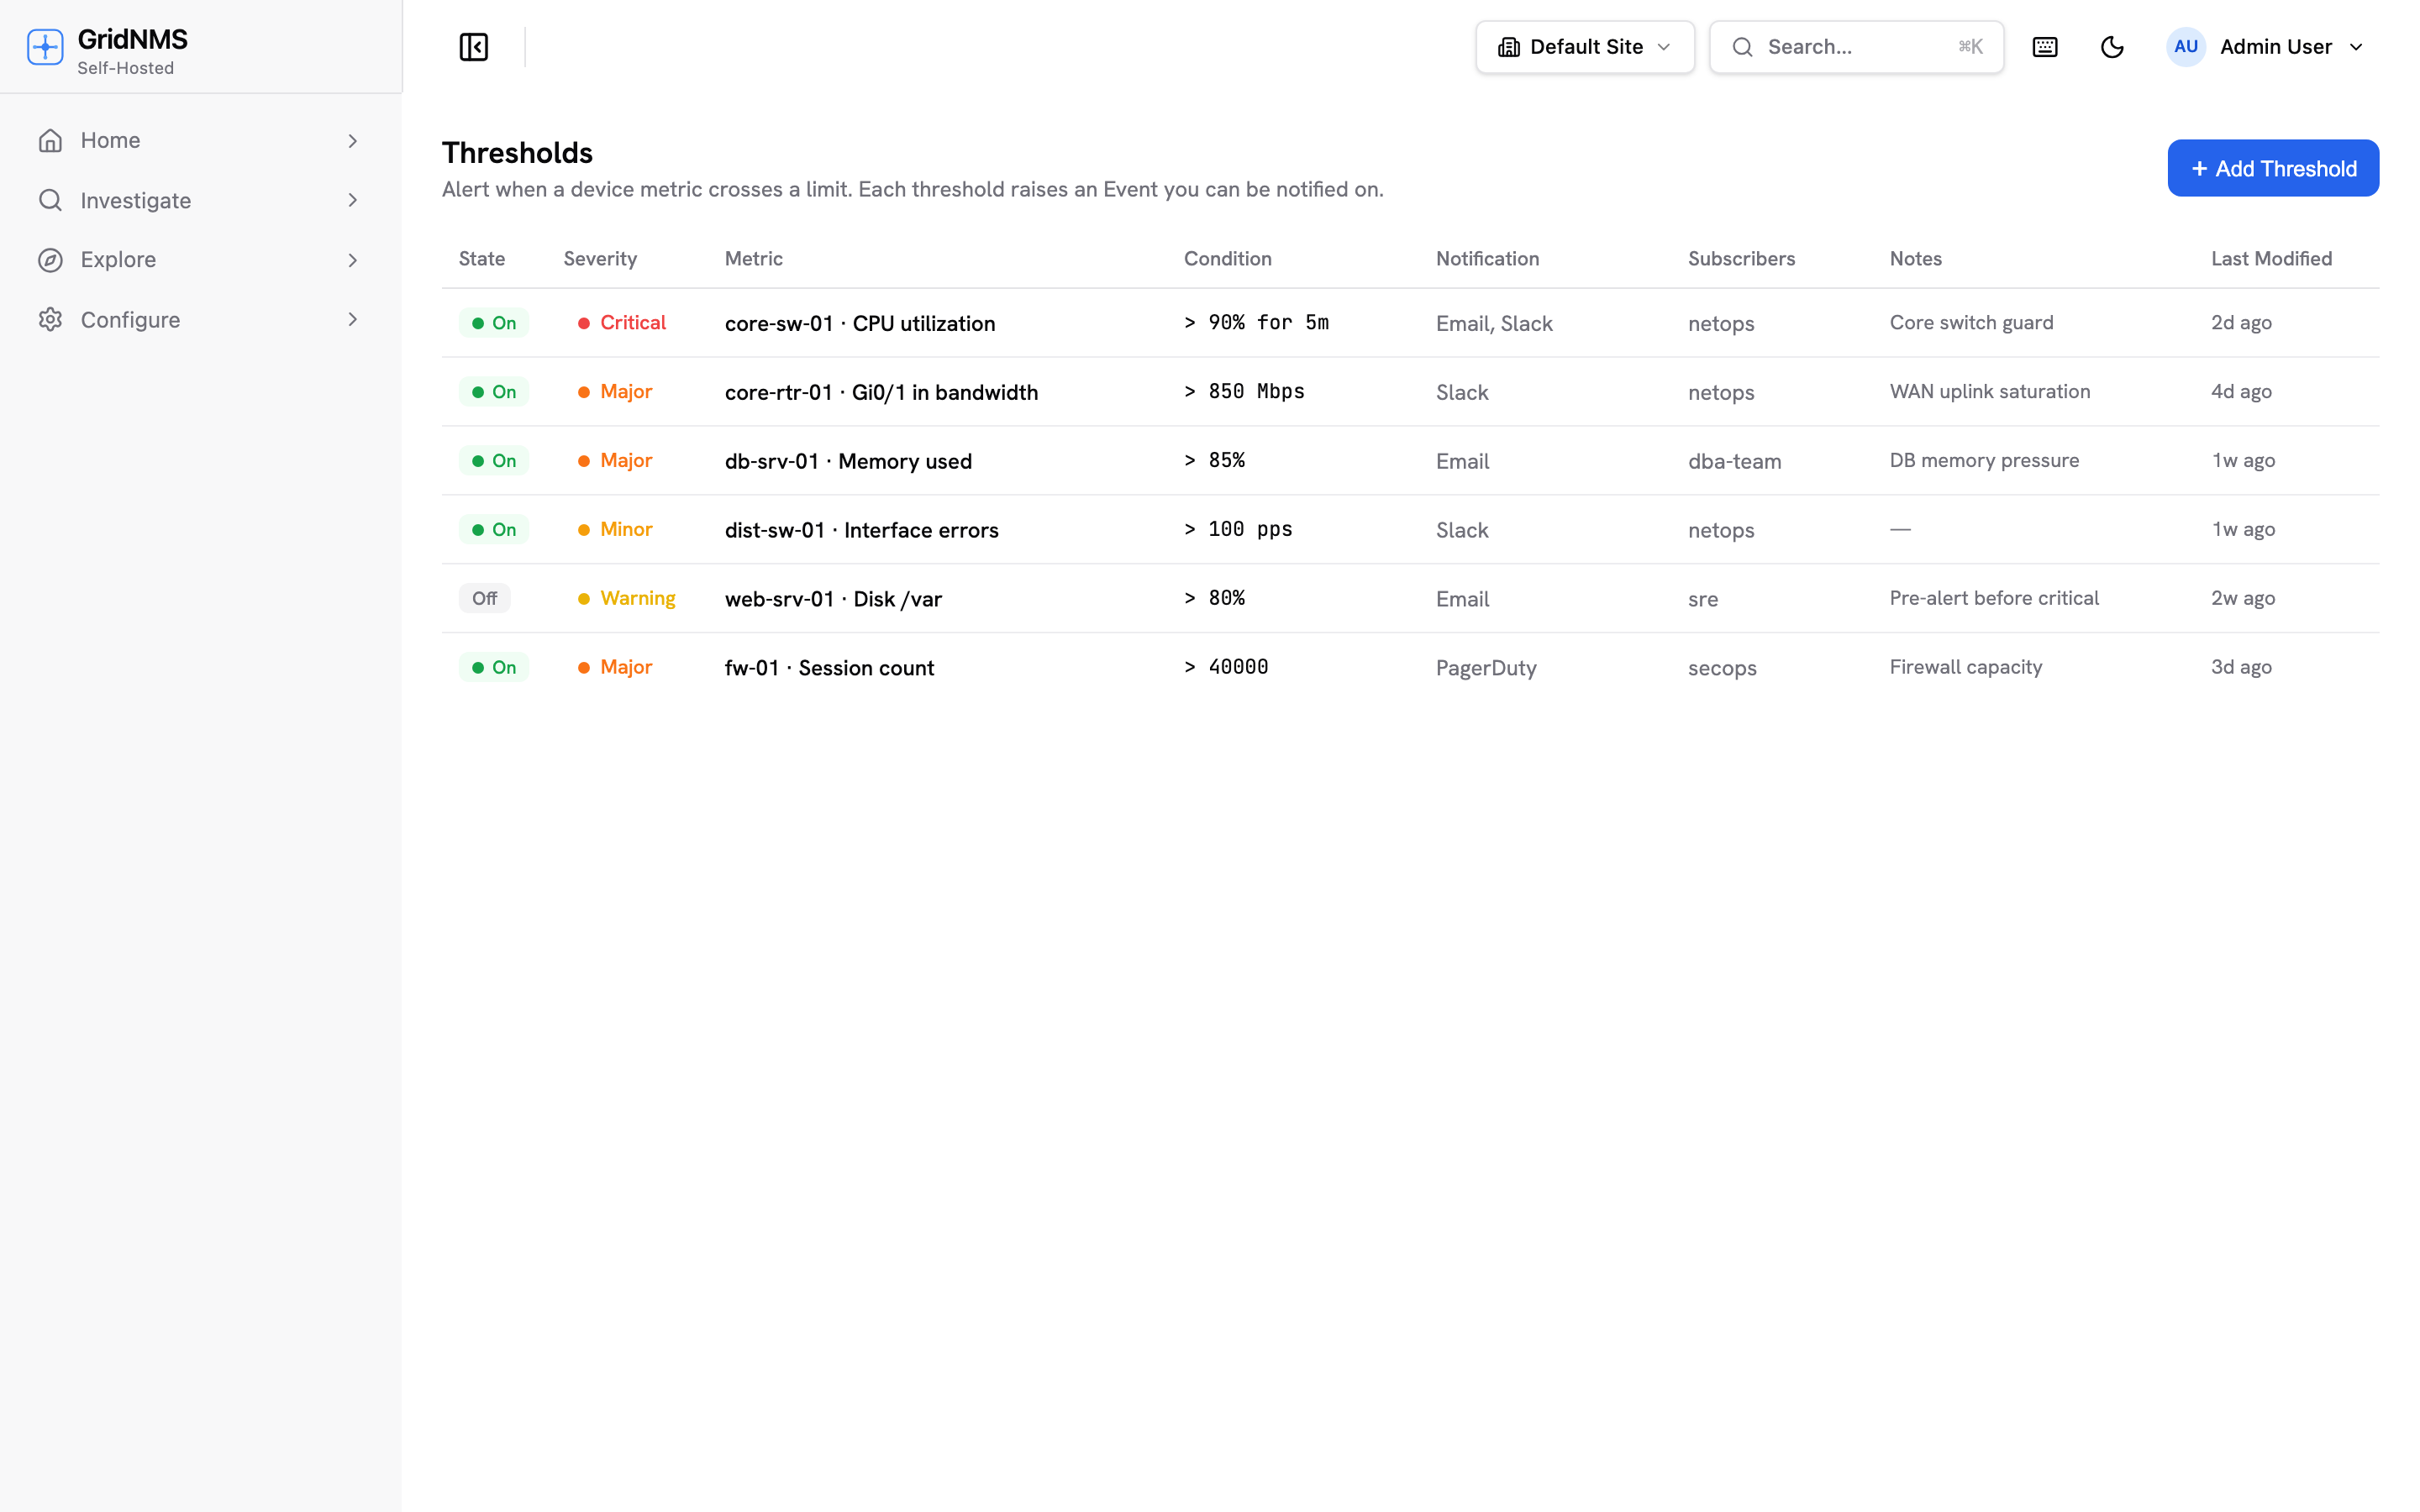 Bandwidth thresholds raise an event automatically when an interface crosses your set rate — and a matching recovery event when traffic falls back.
Creating a threshold rule
Section titled “Creating a threshold rule”Open the interface from a device’s Interfaces tab, switch to its Charts → Thresholds view, and click New Threshold:
- Pick the interface you want to watch (already selected, since you opened it from there).
- Choose the direction — inbound, outbound, or both.
- Set the rate that should trigger the alert (for example, 80% of the link speed, or a fixed value like 800 Mbps).
- Choose the severity the resulting event should carry (see severity levels).
- Optionally enable notification so the alert reaches your chosen endpoints, not just the events feed.
- Save the rule.
What happens when a threshold is crossed
Section titled “What happens when a threshold is crossed”- When traffic rises above your threshold, GridNMS automatically raises an event at the severity you chose. It appears on the Events page and, if you enabled notification, is delivered to your endpoints.
- When traffic falls back below the threshold, GridNMS automatically raises the matching recovery event — you don’t have to notice and report it yourself. Reading both together in the feed tells you exactly when a link ran hot and when it settled back down.
Good thresholds to start with
Section titled “Good thresholds to start with”| Interface | Suggested threshold |
|---|---|
| Internet / WAN uplink | 75–85% of the contracted speed, in the relevant direction. |
| Core / distribution uplinks | 80% of link speed, both directions. |
| Access-layer ports | Usually not worth a threshold individually — watch the aggregate uplink instead. |
Device metric thresholds
Section titled “Device metric thresholds”Bandwidth thresholds watch a single port. To alert on how the device itself is doing — CPU, memory, load, disk, temperature — set a device metric threshold instead.
Open the device, switch to its System Stats tab, and add a threshold next to the charts:
- Pick the metric from the searchable list of everything this device actually reports. Adding one straight from a chart pre-selects that chart’s metric.
- Choose the condition — greater than, at least, less than, or at most.
- Set the value to compare against (for example,
90for a CPU percentage). - Choose the severity the resulting event should carry (see severity levels).
- Optionally add a custom message. Leave it blank and GridNMS writes one for you.
- Optionally turn on notification so it reaches your endpoints, not just the events feed.
Thresholds behave the same way bandwidth thresholds do: crossing the line raises an event at your chosen severity, and recovering raises the matching recovery event. You can turn a threshold off without deleting it, and edit or remove it from the same place.
To alert on a container’s CPU or memory instead, use its Thresholds panel — see Containers.
How monitoring feeds alerts
Section titled “How monitoring feeds alerts”Everything monitoring collects can become an alert:
- A failed reachability check → a device down event.
- A crossed bandwidth threshold → an interface event (auto-cleared when it recovers).
- A crossed device metric threshold → a device event at the severity you chose.
All of these land on the Events & Alerts page and can be routed to people via Notifications.
Where to go next
Section titled “Where to go next”- Understand the underlying mechanics in How Monitoring Works.
- Triage what monitoring raises on the Events & Alerts page.
- Set the right device class and credentials so packs collect correctly.
docs built 2026-09-26 · 195c6d00