
Events & Alerts
An event is GridNMS telling you that something happened: a device went down, an interface saturated, a trap arrived, or a log pattern matched. The Events page is where you see all of it as it happens and search the full history. This page covers everything from daily triage to the rules that quiet the noise.
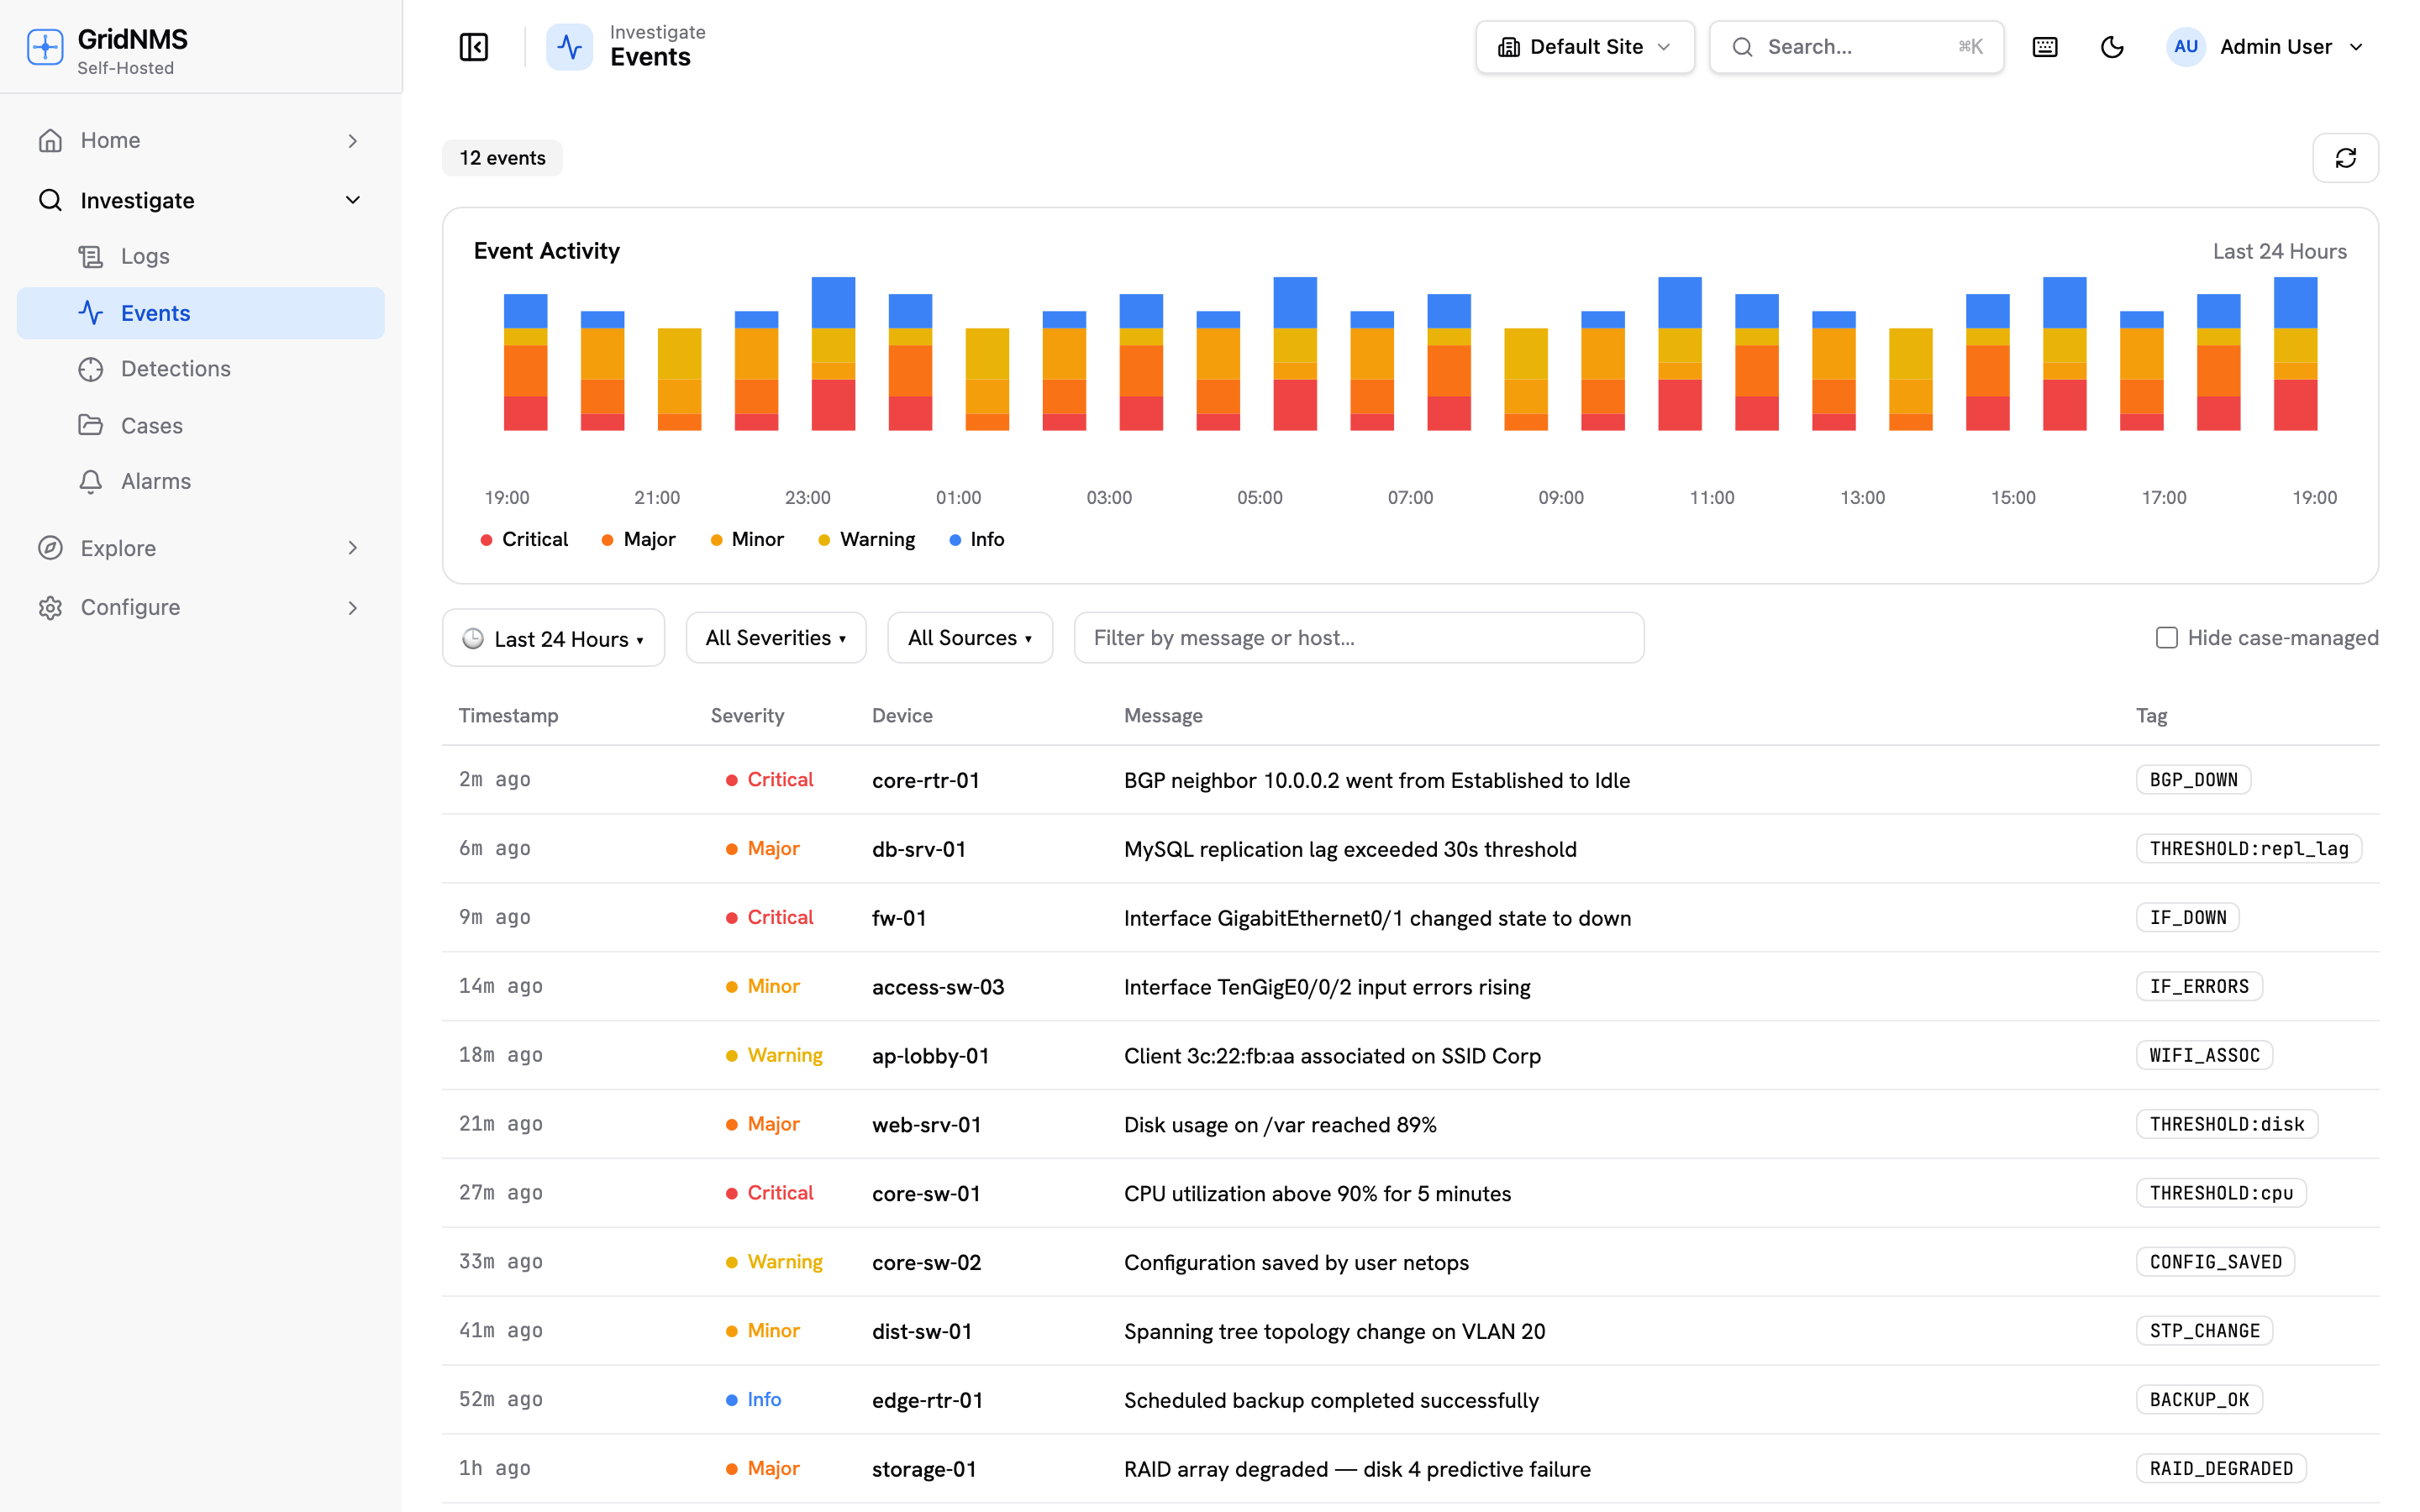 The Events page: a live, severity-colored feed with a histogram and time-range controls.
The Events page
Section titled “The Events page”Open Events to see your live event feed. Each row is one event, showing its
timestamp, severity, the device it relates to, a message, and a
tag (a short label like PING_DOWN that groups related events). The feed is
color-coded by severity so the most serious items stand out. Click a row to
expand it in place for the full detail — the raw message, what raised it, and a
link to matching log lines when it came from a log detection.
Severity levels
Section titled “Severity levels”Events are ranked by severity, from most to least urgent. See severity levels for the full reference, but in short:
| Severity | Meaning |
|---|---|
| Critical | Major impact — needs attention now. |
| Major | Significant problem. |
| Minor | A smaller issue worth knowing about. |
| Warning | Early or low-impact signal. |
| Info | Informational; no action required. |
The severity histogram and time range
Section titled “The severity histogram and time range”Above the feed, a histogram shows event volume over time, broken down by severity. Use the time-range picker to focus the histogram and the feed on a window — the last hour during an active incident, or the last week for a review. The histogram makes spikes obvious: a sudden tall bar of Critical events usually means a real outage just started.
Events are a record, not a to-do list
Section titled “Events are a record, not a to-do list”An event is a permanent, point-in-time record of something that happened — it isn’t marked “open” and there’s nothing to acknowledge or close on the event itself. A device that goes down and comes back up produces two events (down, then up), not one event that changes state. That’s what makes the Events page a trustworthy history: nothing here is ever edited after the fact.
When monitoring recovers on its own — a device comes back, or an interface drops back under its threshold — GridNMS records that as its own recovery event right alongside the original one, so the full story stays in the feed.
Working an incident: Cases
Section titled “Working an incident: Cases”The actual triage workflow — deciding what’s being worked, by whom, and whether it’s resolved — happens in Cases, not on individual events. When a single device or incident generates a flood of events, Cases groups the related ones into one investigation with its own status (Open → Investigating → Resolved → Closed), an owner, and a timeline you build as you work it. An event already pulled into a case shows a Case badge you can click straight through to the investigation. Use Hide case-managed events on the feed to see only what hasn’t been triaged yet. See Cases for the full workflow.
Searching event history
Section titled “Searching event history”The live feed shows what’s current. To dig into the past — for an audit, a post-incident review, or to confirm how often something recurs — use Event History search. You can filter by:
- Date range — any window, not just recent.
- Device — everything that happened to one device.
- Severity — only Critical, only Warning, and so on.
- Text — match words in the event message.
History is kept far longer than the live feed, so you can answer questions like “how many times did this uplink flap last month?”
Where events come from
Section titled “Where events come from”Events are raised from several sources, all flowing into the same feed:
| Source | Example event |
|---|---|
| Reachability checks | A device stops responding → device down. |
| Thresholds | An interface crosses its bandwidth threshold. |
| SNMP traps | A device sends an unsolicited alert (e.g. a power-supply fault). |
| Log detections | An incoming log matches a detection rule (e.g. repeated auth failures). |
From the feed, matching events can be delivered to people through Notifications.
Transformation rules (admin)
Section titled “Transformation rules (admin)”Administrators can shape events before they reach you using transformation rules. Each rule matches events by criteria (device, class, severity, message text) and then takes an action:
| Action | What it does |
|---|---|
| Tag | Add a label to matching events for easier filtering. |
| Change severity | Raise or lower how urgent an event is treated. |
| Suppress | Drop noisy, known-benign events before they ever reach the feed. |
Transformation rules are how you tune GridNMS to your environment — for example, downgrading a chatty informational trap to Info, or suppressing a known cosmetic warning so it never clutters the feed. This is the Event Rules half of the full editor — see Transformations for match conditions, the full action list, and its sibling engine for cutting log volume before storage.
Maintenance windows
Section titled “Maintenance windows”Planned work shouldn’t page anyone. A maintenance window tells GridNMS a device is expected to be offline during a scheduled period — events still get recorded (tagged Maintenance, so you keep a full audit trail), but their notifications are held back so nobody gets paged for a change you made on purpose. See Maintenance Windows for the full walkthrough.
Where to go next
Section titled “Where to go next”- Get alerts delivered to email, Slack, and on-call tools in Notifications.
- Tune what raises events in the first place via Monitoring and Logs.
- Look up exact severity definitions in severity levels.
docs built 2026-09-26 · 195c6d00