
The Dashboard
The dashboard is the first thing you see when you sign in to GridNMS. It pulls together the most important signals about your network — what’s up, what’s down, what just changed, and what needs attention — into a single screen you can scan in seconds.
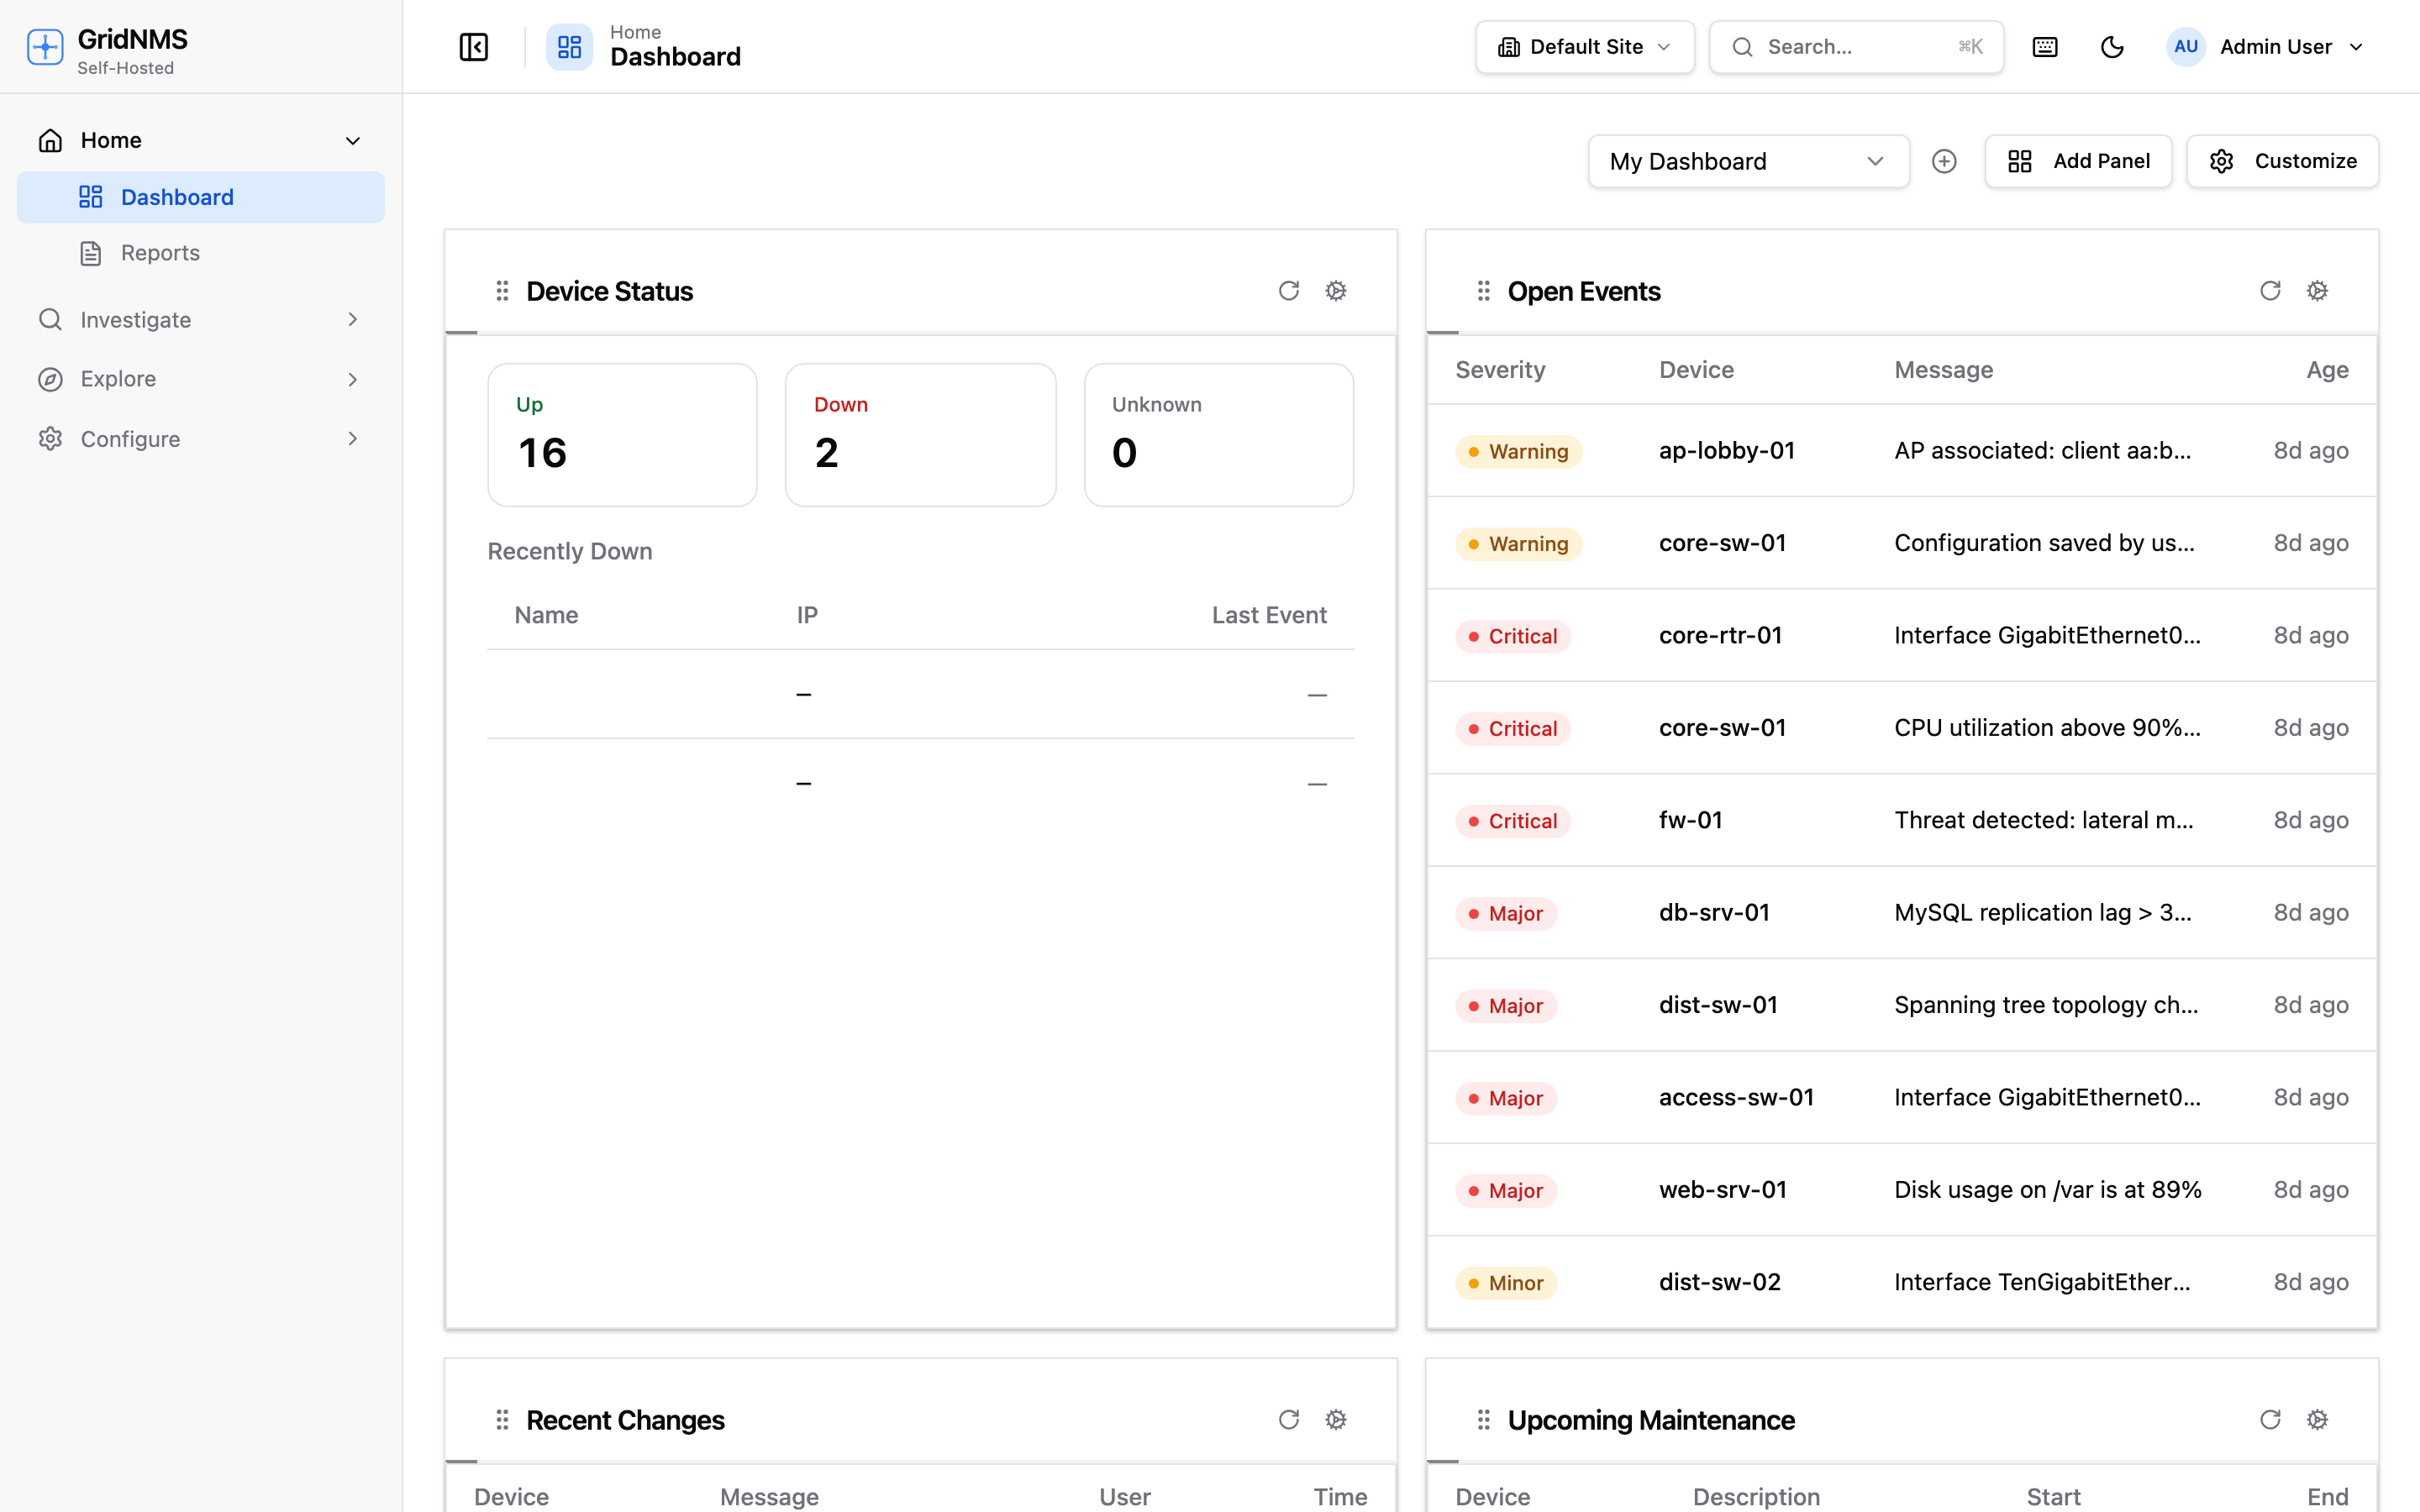 The dashboard shows device status and open events at a glance.
What you’ll find here
Section titled “What you’ll find here”The dashboard is built from panels. Each panel is a self-contained widget that shows one kind of information. A fresh install comes with a sensible default layout, and you can rearrange, add, or remove panels to suit how your team works.
Common panels include:
| Panel | What it shows |
|---|---|
| Device status | A breakdown of how many devices are Up, Down, or Unknown, usually as a donut or stat card. |
| Recent events | The most recent events, color-coded by severity. |
| Open cases | Your active cases — the investigations actually being worked, worst severity first. |
| Recent changes | Devices that recently went up or down, interfaces that flapped, and other state transitions. |
| Upcoming maintenance | Planned maintenance windows so you know which devices are expected to be offline. |
| Top event sources | The devices generating the most events — a quick way to spot a noisy or failing device. |
| Top log sources | The hosts sending the most log volume over the last 24 hours. |
| Metric graphs | Live charts for traffic, CPU, memory, and other monitored metrics. |
Reading device status
Section titled “Reading device status”The device status panel uses three states, the same ones used throughout GridNMS:
- Up — the device is reachable and responding to monitoring.
- Down — the device failed its reachability check and is considered offline.
- Unknown — GridNMS has not yet been able to determine the device’s state (for example, it was just added, or its collector is offline).
Clicking any segment or number takes you straight to a filtered device list so you can see exactly which devices are in that state.
The Site selector
Section titled “The Site selector”If your organization has more than one site, a Site selector appears at the top of the page. Use it to scope the entire dashboard — and most other pages — to a single location, or choose All sites to see everything together. This is handy when different teams own different buildings, campuses, or regions.
Global search (Cmd/Ctrl+K)
Section titled “Global search (Cmd/Ctrl+K)”Press Cmd+K (Mac) or Ctrl+K (Windows/Linux) anywhere in GridNMS to open global search. Start typing a device name, IP address, interface, or page name and jump straight there. It’s the fastest way to pull up a specific device without clicking through menus.
Customizing your dashboard
Section titled “Customizing your dashboard”You can shape the dashboard to match what your team needs to watch.
Add a panel
Section titled “Add a panel”- Click Customize (or Edit layout) in the top-right of the dashboard.
- Click Add Panel.
- Choose a panel type from the list and confirm.
- The new panel appears at the bottom of the layout, ready to be positioned.
Adding a graph or metric panel
Section titled “Adding a graph or metric panel”Beyond the built-in status panels, you can add graph panels that chart a device’s monitored metrics — traffic, errors, packets, CPU, a service’s response time — right on the dashboard.
The most direct way to create one is from the Device Metrics page:
- Go to Explore → Device Metrics and pick the device (and, for traffic, the interface) you want to chart.
- Choose the metric and the time range you’d like the chart to cover — for example, Traffic on an uplink over the last 24 hours.
- Pin the chart to a dashboard. It’s added as a graph panel on that dashboard, ready to position like any other.
Once a graph panel is on a dashboard, open its menu (the ⋯ / Cog icon in its corner) to:
- Change its time range (1h, 6h, 24h, 7d, 30d) so the panel always shows the window you care about.
- Set its column span to make a busy chart wider.
- Copy it to another dashboard, or unpin it.
The panel library you reach through Add Panel also lists the other panel types you can drop onto any dashboard:
| Panel type | What it shows |
|---|---|
| Device Status | Up / Down / Unknown counts and recently-down devices. |
| Recent Events | The latest events by severity. |
| Open Cases | Your active cases — investigations and correlated incidents. |
| Recent Changes | The latest configuration and state changes. |
| Upcoming Maintenance | Scheduled maintenance windows. |
| Top Event Sources | The devices generating the most events. |
| Top Log Sources | The hosts sending the most log volume in the last 24 hours. |
| Service Status | Rollup health across your monitored services, plus a 24-hour status timeline per service. |
| Collector Status | A row per collector — online state, version, heartbeat age, the devices it owns, and 24-hour CPU, memory, and log-volume sparklines. |
| Log Forwarder Status | Delivery health of your log forwarders, with any offline ones called out. |
| Graph / metric panels | Live charts for a device metric or service latency (pinned from Device Metrics). |
The Service Status, Collector Status, and Log Forwarder Status panels are off until you add them — like every panel, they are opt-in rather than assumed.
Reading the Service Status panel
Section titled “Reading the Service Status panel”Beyond the up / degraded / down / unknown counts, the panel lists your services worst-first (down before degraded before unknown), each with a 24-hour status timeline so you can see at a glance whether a service has been solidly up or flapping. Click a service to open it; view all goes to the full Service Monitoring page. Only the first few services are listed, so the panel stays readable on a wall display.
Reading the Collector Status panel
Section titled “Reading the Collector Status panel”Each collector gets a row with its site, version, how long since its last heartbeat, how many of its devices are up and down, how many log forwarders report through it, and small CPU, memory, and logs/hour charts covering the last 24 hours. Underneath, an Issues list calls out anything that needs attention — a collector that is unhealthy, one whose configuration failed to apply or is still pending, and devices that are down.
A metric GridNMS has not measured shows as —, never as a zero. That
distinction matters: 0 means “measured, and it really is zero”, while — means
“no reading yet” — so an idle collector never looks the same as an unreachable one.
Rearrange and resize
Section titled “Rearrange and resize”While in customize mode:
- Drag and drop any panel by its title bar to reorder the layout.
- Resize a panel by changing its column span — narrow panels sit side by side, while a full-width panel spans the whole row. Stat cards work well narrow; event feeds and charts usually want more width.
Per-panel refresh interval
Section titled “Per-panel refresh interval”Each panel can refresh on its own schedule. Open a panel’s menu (the ⋯ icon in its corner) and set how often it should reload its data — for example, every 30 seconds for the open-events feed, or every 5 minutes for a slower-moving inventory count. Faster refresh keeps data current; slower refresh is lighter on busy displays.
Save and exit
Section titled “Save and exit”When the layout looks right, click Done or Save. Your changes are stored to your account, so the dashboard looks the same the next time you sign in.
Multiple saved dashboards
Section titled “Multiple saved dashboards”You can keep more than one dashboard and switch between them from the dashboard selector at the top of the page. This lets you build purpose-specific views — for example:
- An NOC wallboard with large status cards and the open-events feed.
- A capacity view full of traffic and utilization charts.
- A per-site view scoped to one building for the team that runs it.
Create a new dashboard from the selector menu, give it a name, lay out its panels, and save. Switching between them is instant.
Where to go next
Section titled “Where to go next”- See every device and drill into one in Devices & Inventory.
- Triage alerts and work investigations on Events & Alerts and Cases.
- Understand how status is determined in How Monitoring Works.
docs built 2026-09-26 · 195c6d00