
Monitoring & Managing Collectors
Collectors are the workhorses that poll your devices and receive their logs and traps. GridNMS gives you two views into their health: a per-collector view for detail, and a fleet-wide view for an at-a-glance picture across every collector and background service.
Collector updates: a per-host reinstall
Section titled “Collector updates: a per-host reinstall”There’s no automatic in-place upgrade for a collector. To move one to a newer version, download the newer build from the Customer Portal → Downloads and re-run the installer on that host — it’s safe to run on an already-installed collector and won’t lose its enrollment. See Installing a Collector → Updating.
Per-collector health
Section titled “Per-collector health”Go to Configure → Collectors. The list shows every registered collector with an Online or Offline indicator and when it was last seen.
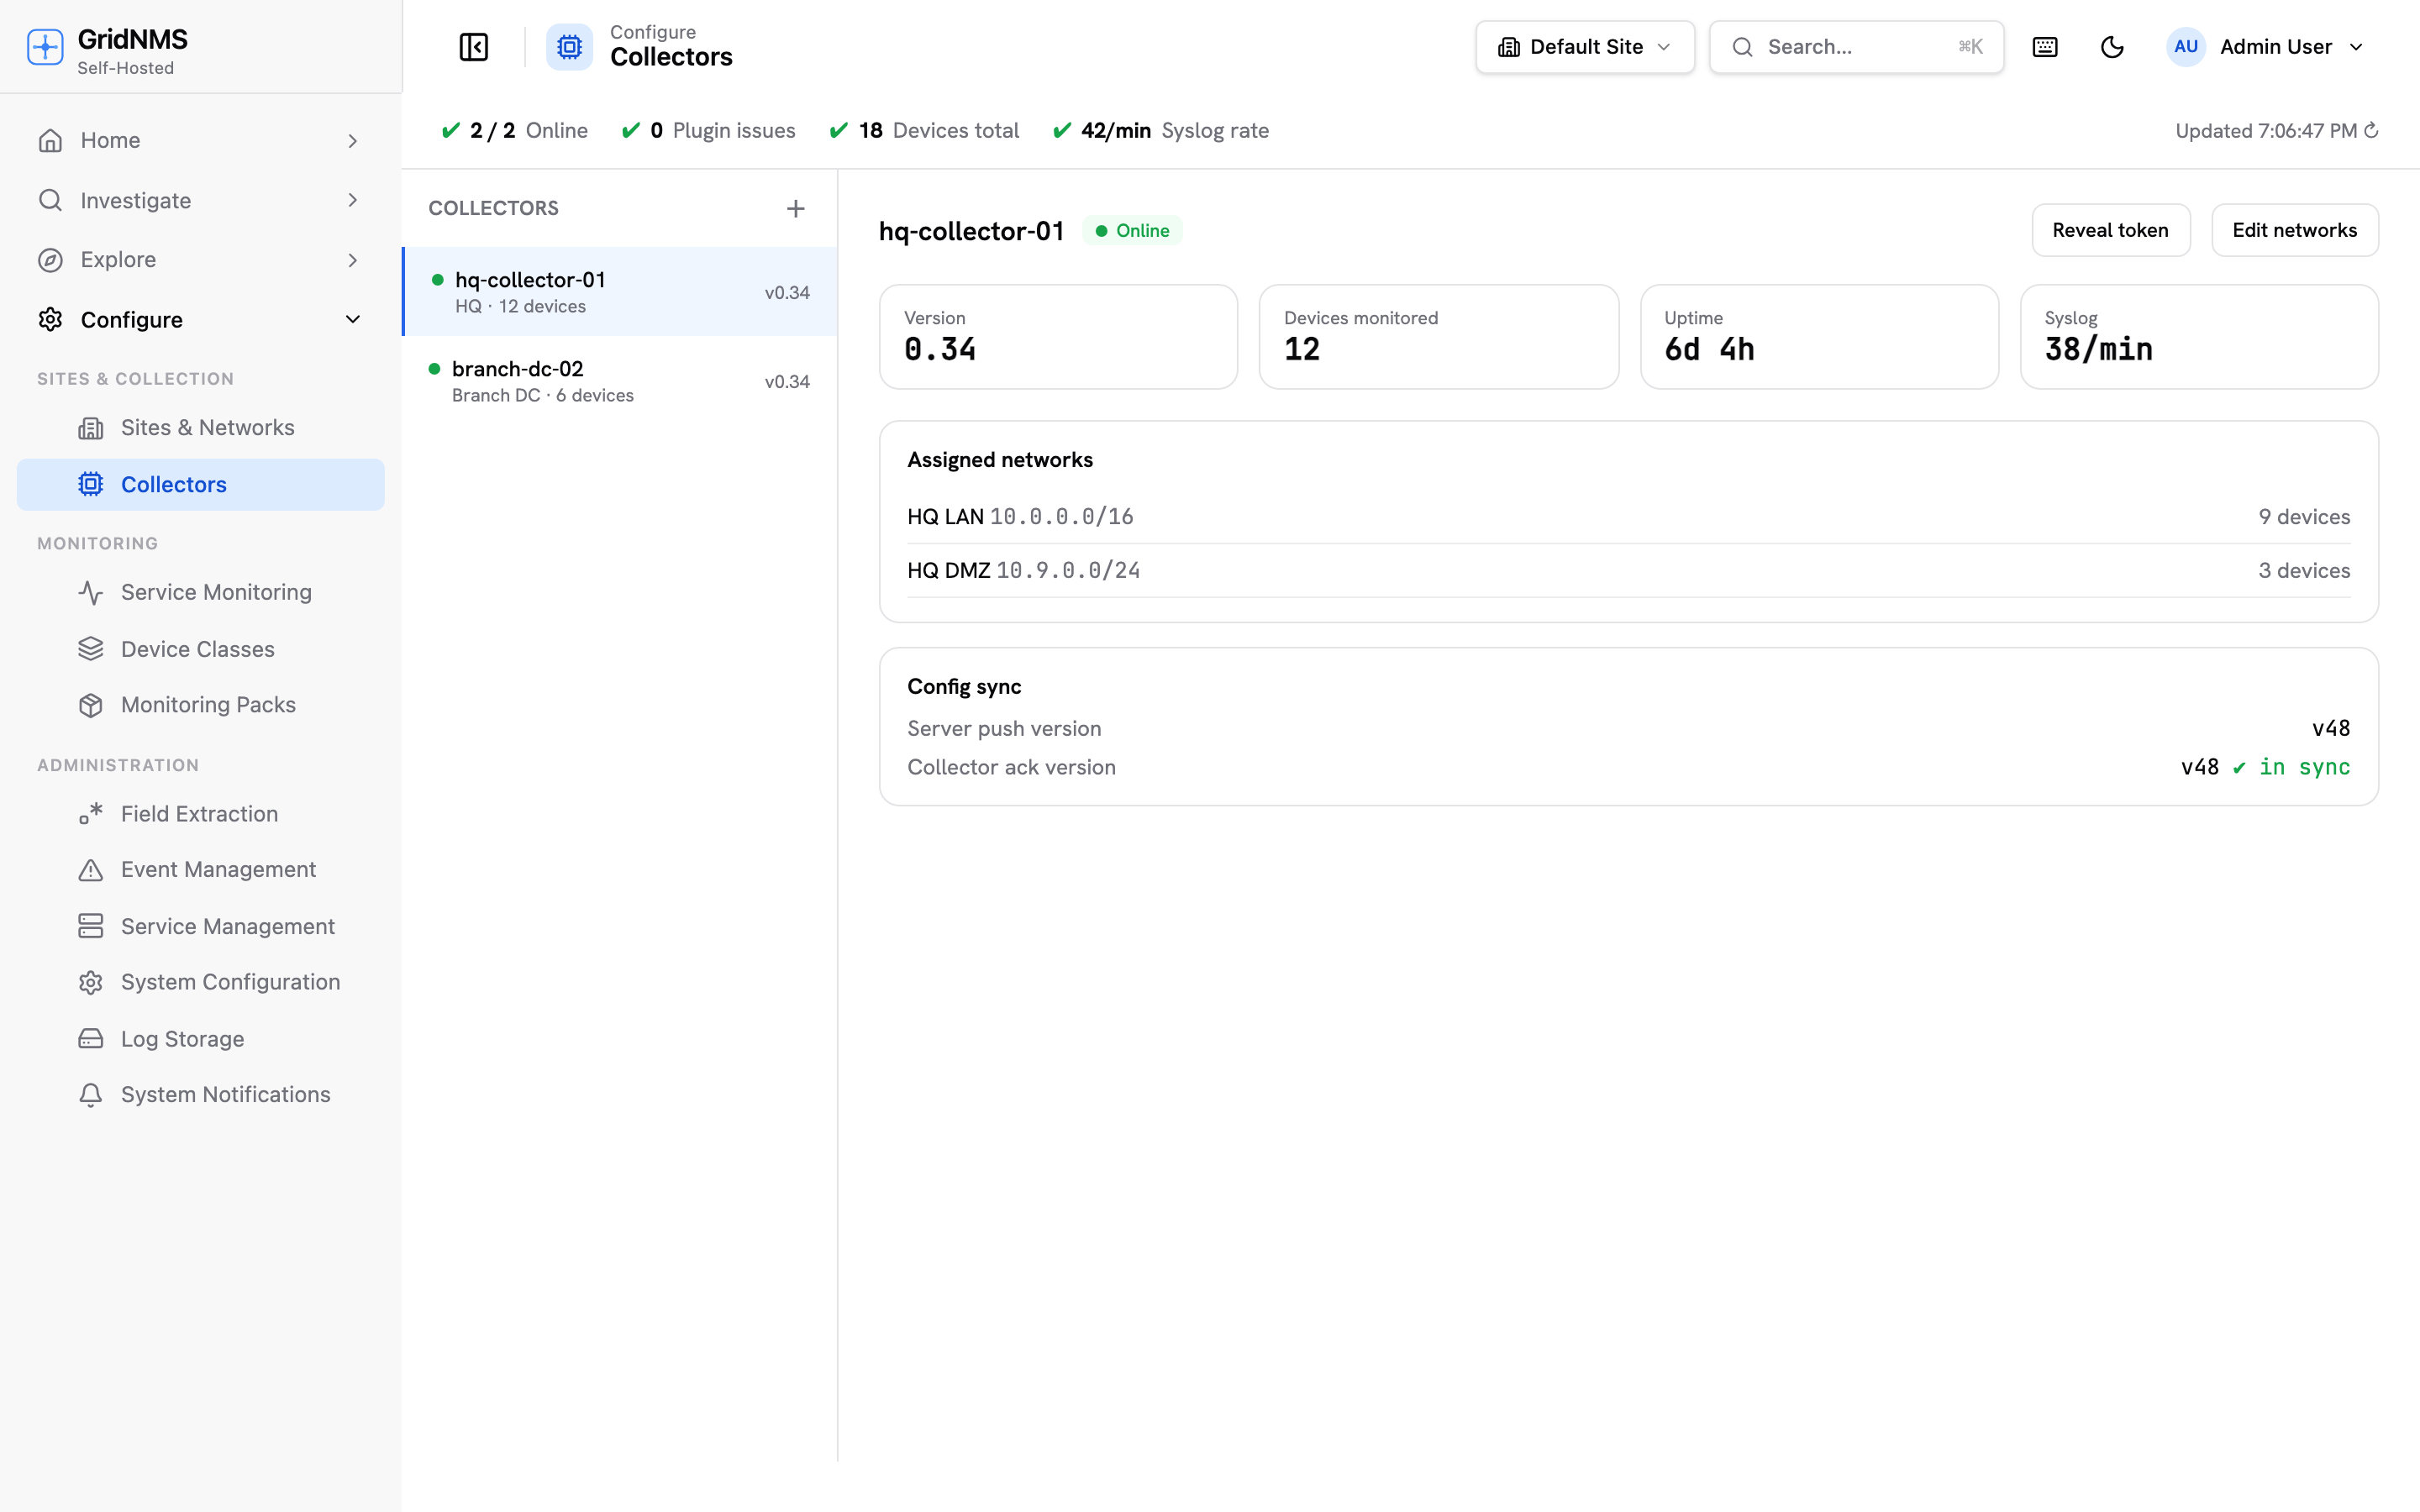 Configure → Collectors. Each collector shows online/offline status; open one for its Overview, Health, Settings, and Security tabs.
Open a collector to see its detail tabs:
- Overview — connection info and the networks assigned to this collector.
- Health — live status and metrics: what it’s running, plugin status, resource usage over time, and pipeline stats for log and metric delivery. See Reading a Collector’s Health Tab for what each card means.
- Settings — listen ports, log ingestion, which plugins are enabled, and software/version info. This is also where you choose where the collector ships its logs.
- Security — revoke the collector’s identity, manage its IP allowlist, and review recent security events for it.
Revoking a collector
Section titled “Revoking a collector”Revoke collector identity on the Security tab is what to reach for if a collector’s host is lost or you believe it has been tampered with. Select Revoke now and the cut-off is immediate:
- Its credentials are rotated, so it can no longer fetch its configuration or the device credentials it was holding, and a reconnecting session is refused.
- Any session it has open is force-closed within a few seconds — the tab tells you when that has been confirmed.
- It is dropped from the set of collector identities the log pipeline recognises.
Revoking is not a substitute for containing the machine itself. If you believe the host is compromised, isolate it on your network as well — revoking removes its access to GridNMS, not your attacker’s access to the host.
The collector stays in your list with its site and network assignments intact — revoking cuts the machine off, it doesn’t undo what you configured. To bring a host back, re-join it with a fresh token; it is issued new credentials rather than reusing anything the old host held.
Devices that collector was responsible for have no one to poll them until another collector covers their network, so plan the replacement alongside the revocation rather than after it.
Plugin status
Section titled “Plugin status”A collector runs several workers, each shown as a chip on the Health tab:
| Plugin | What it does |
|---|---|
| Monitor | Liveness checks — is each device up? |
| Poller | Collects metrics and details from devices. |
| Syslog | Receives syslog messages from devices. |
| SNMP Traps | Receives SNMP traps from devices. |
| Service Monitoring | Synthetic HTTP / DNS / SMTP / SMB checks. |
| Discovery | Active network discovery scans (on-demand, not continuous). |
Each chip always shows whether that worker is enabled or disabled for the collector (turned on/off under Settings). On collectors that report a live runtime status, the chip also turns green with a Running label when it’s confirmed working; a worker that isn’t currently doing anything (for example, the trap listener when nothing is sending traps) simply reads enabled without the green confirmation — that’s normal, not a problem.
Metric bars, last-seen, and stale detection
Section titled “Metric bars, last-seen, and stale detection”The Health tab shows recent history for the collector’s resource usage — memory, CPU, and disk — and, when the collector reports it, tunnel latency and a devices-monitored trend.
A collector reports in with a heartbeat about every 30–60 seconds. If GridNMS hasn’t heard from it in a couple of minutes, the last known figures are shown with a stale metrics warning. Stale metrics on an otherwise-online collector usually mean it’s under heavy load or its connection is unstable.
Fleet-wide view: Service Management
Section titled “Fleet-wide view: Service Management”For the big picture, go to Configure → Service Management. This page shows the health of the background services that keep monitoring running, alongside collector status across your whole fleet — all on one screen.
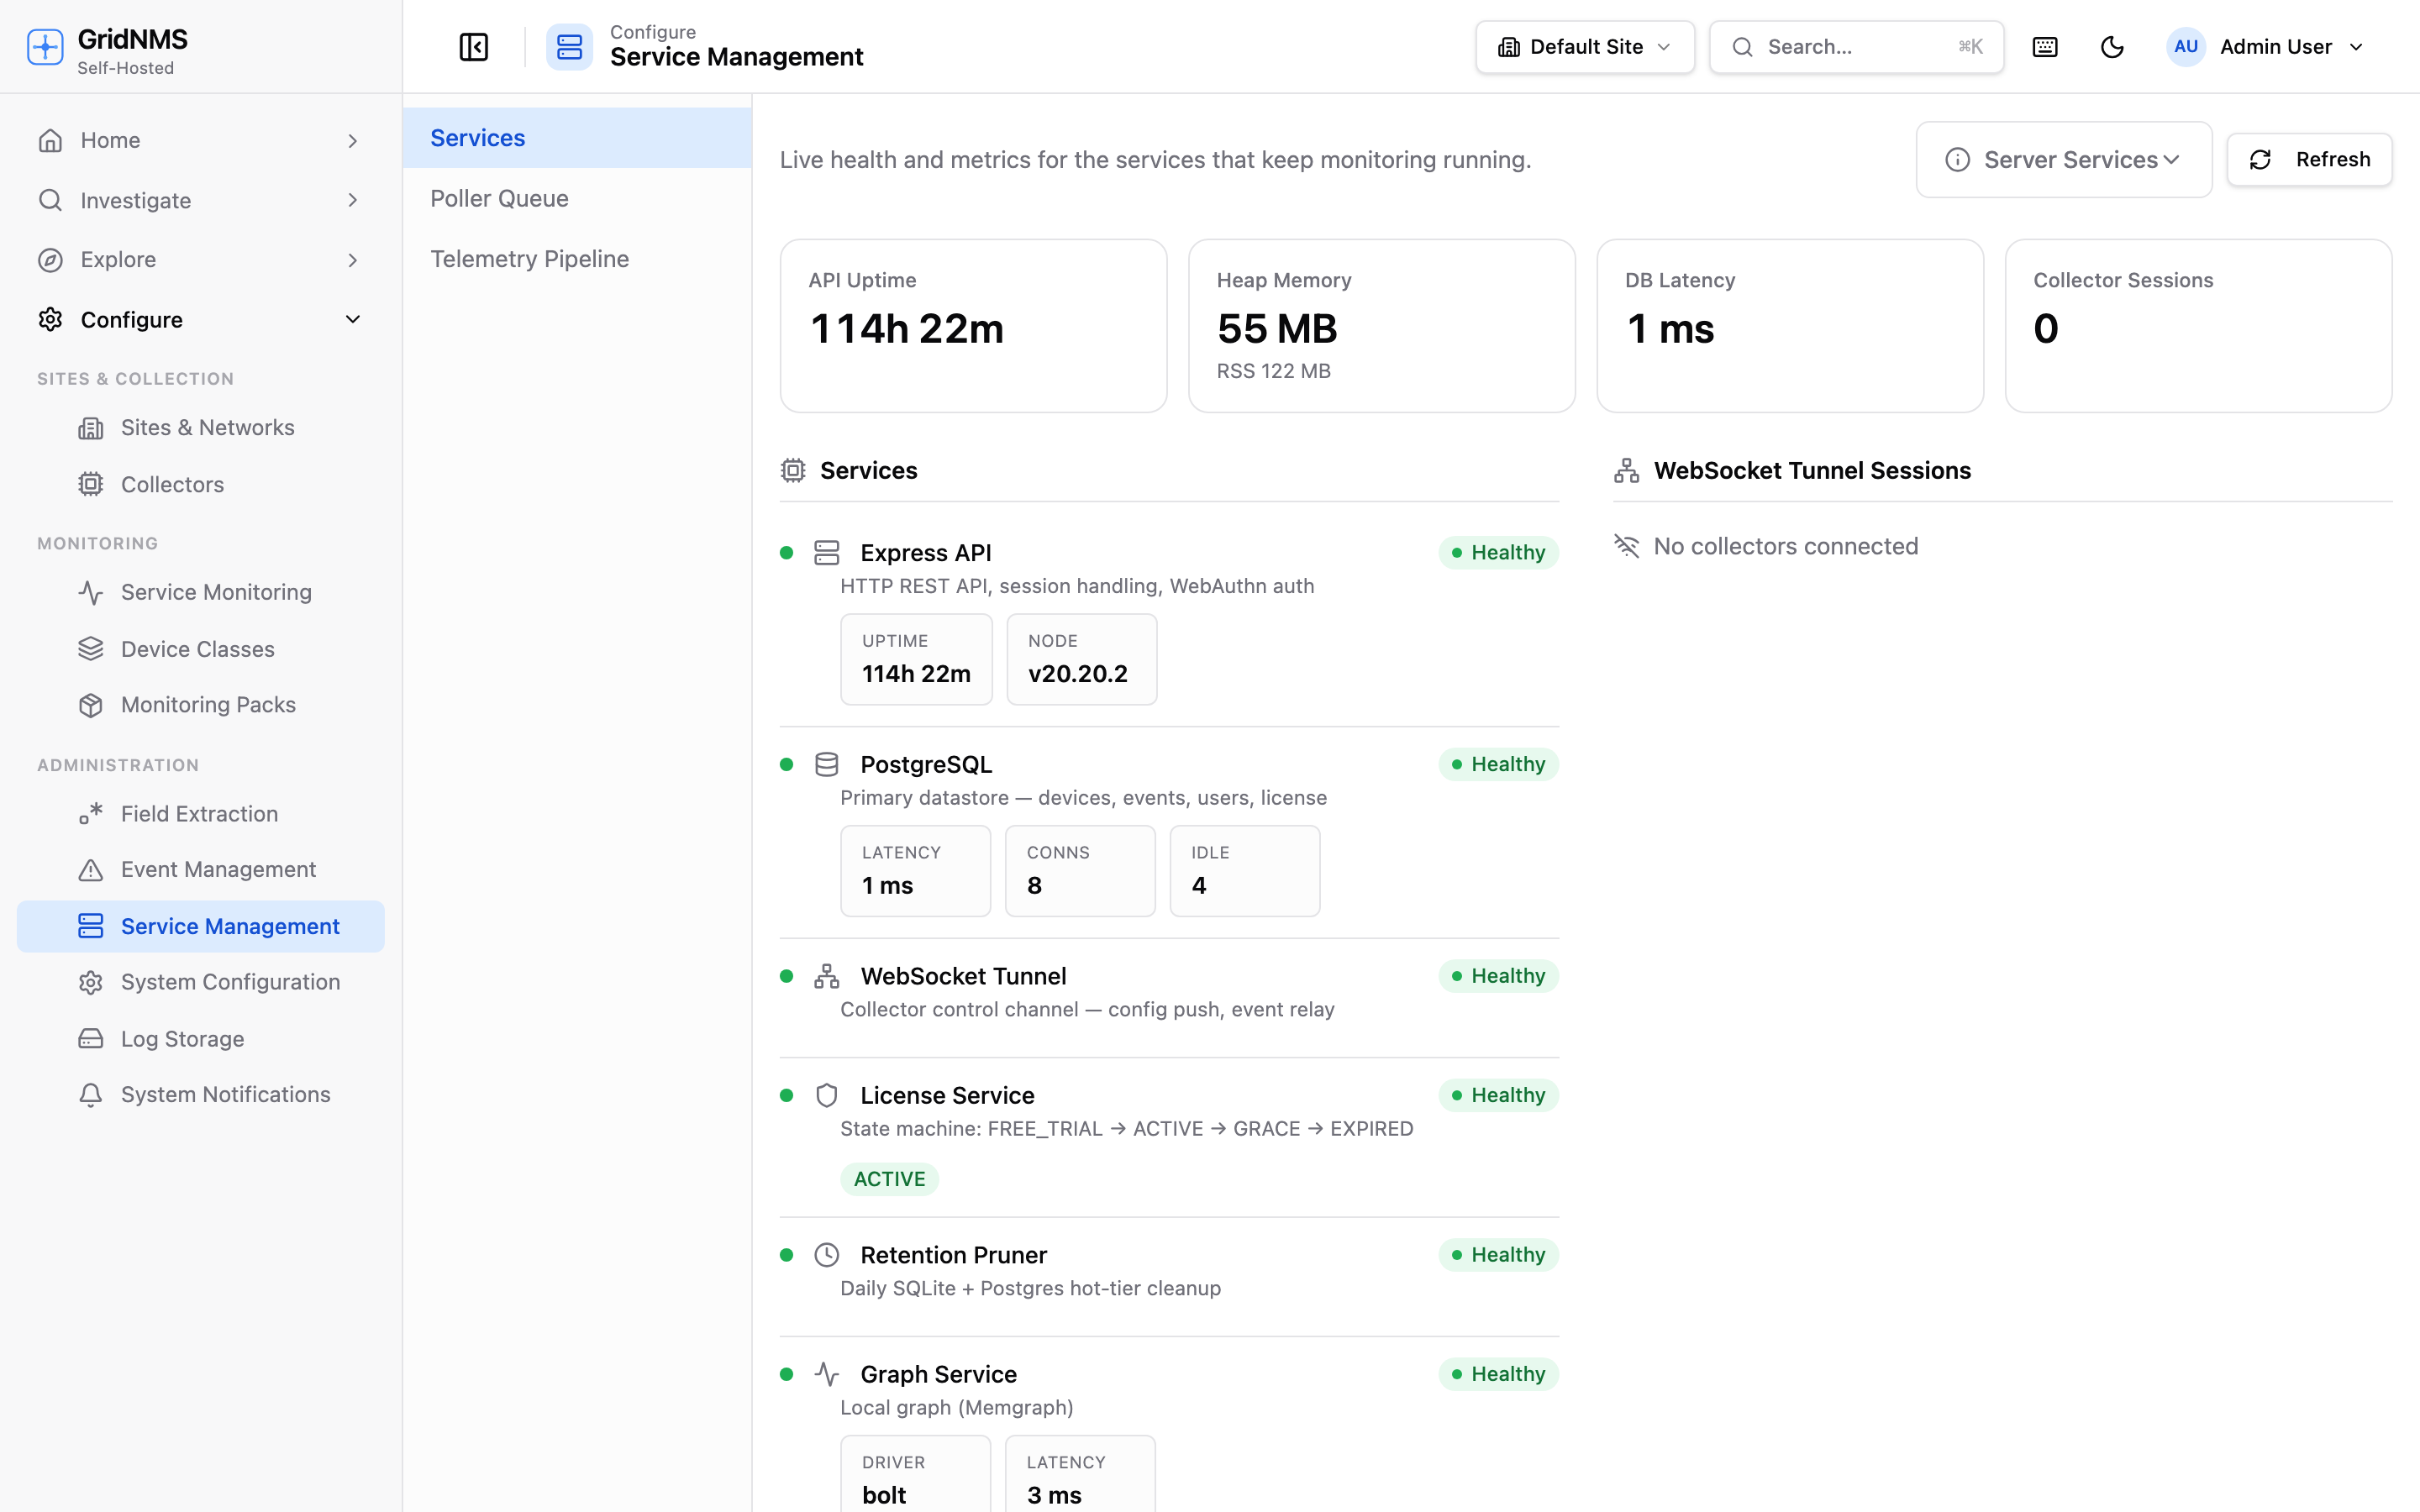 Configure → Service Management gives an at-a-glance view of background services and connected collectors.
At the top you get summary figures, and below them:
- Services — each core service with a Healthy / Degraded / Unknown badge. A green dot means it’s fine; red means it needs attention.
- Connected collectors — every collector currently connected, with how long it’s been up. If a collector you expect is missing here, it isn’t connected.
- Trend charts — recent history for key measures (memory, response time, event rate, and connected collectors) so you can see whether something is trending the wrong way rather than just its value right now.
Use Service Management as your daily glance, and drill into an individual collector under Configure → Collectors when something there looks off.
What healthy looks like
Section titled “What healthy looks like”- Every expected collector shows Online.
- Every plugin you rely on shows enabled, and where a live status is reported, it’s Running rather than crashed.
- Resource usage (memory, CPU, disk) is well below the host’s own limits.
- On the Health tab’s pipeline stats, backlog / queue depth stays near zero and metric-write drops aren’t climbing (see Reading a Collector’s Health Tab).
- No stale metrics warnings.
First steps when something’s wrong
Section titled “First steps when something’s wrong”A collector is Offline
Section titled “A collector is Offline”- Confirm the collector process is actually running where you deployed it.
- Check its network path to GridNMS — the collector makes an outbound connection, so a firewall or proxy change can cut it off.
- Once connectivity returns, the collector reconnects on its own — you don’t need to re-register it.
- Check last seen on the Collectors list to gauge how long it’s been gone.
Logs seem to be backing up or dropping
Section titled “Logs seem to be backing up or dropping”- Open the collector’s Health tab and watch the backlog / queue depth pipeline stat.
- If it drains back toward zero, it was a temporary traffic burst — nothing to do.
- If it keeps climbing, the collector is receiving more than it can ship. The collector may be undersized for its log volume, or its connection to GridNMS may be constrained.
- You can always confirm delivery directly in Logs & Log Search — see Reading a Collector’s Health Tab for what each pipeline stat means.
A plugin isn’t running
Section titled “A plugin isn’t running”- Give it a moment — a crashed worker usually restarts automatically.
- If it doesn’t recover, the collector is likely under stress or hitting a limit. Check its resource usage on the Health tab.
- If it persists, see Troubleshooting.
Related pages
Section titled “Related pages”- Collector Services — what each service does, and where to turn one on.
- Reading a Collector’s Health Tab — what each plugin chip, chart, and pipeline stat means.
- Receiving Logs & Traps — how devices send logs to a collector.
- Troubleshooting — deeper fixes when the first steps don’t resolve it.
docs built 2026-09-26 · 195c6d00