
Graph Explorer
Graph Explorer is where you see how your network fits together: devices, interfaces, and services laid out as a live, interactive graph you can query and explore.
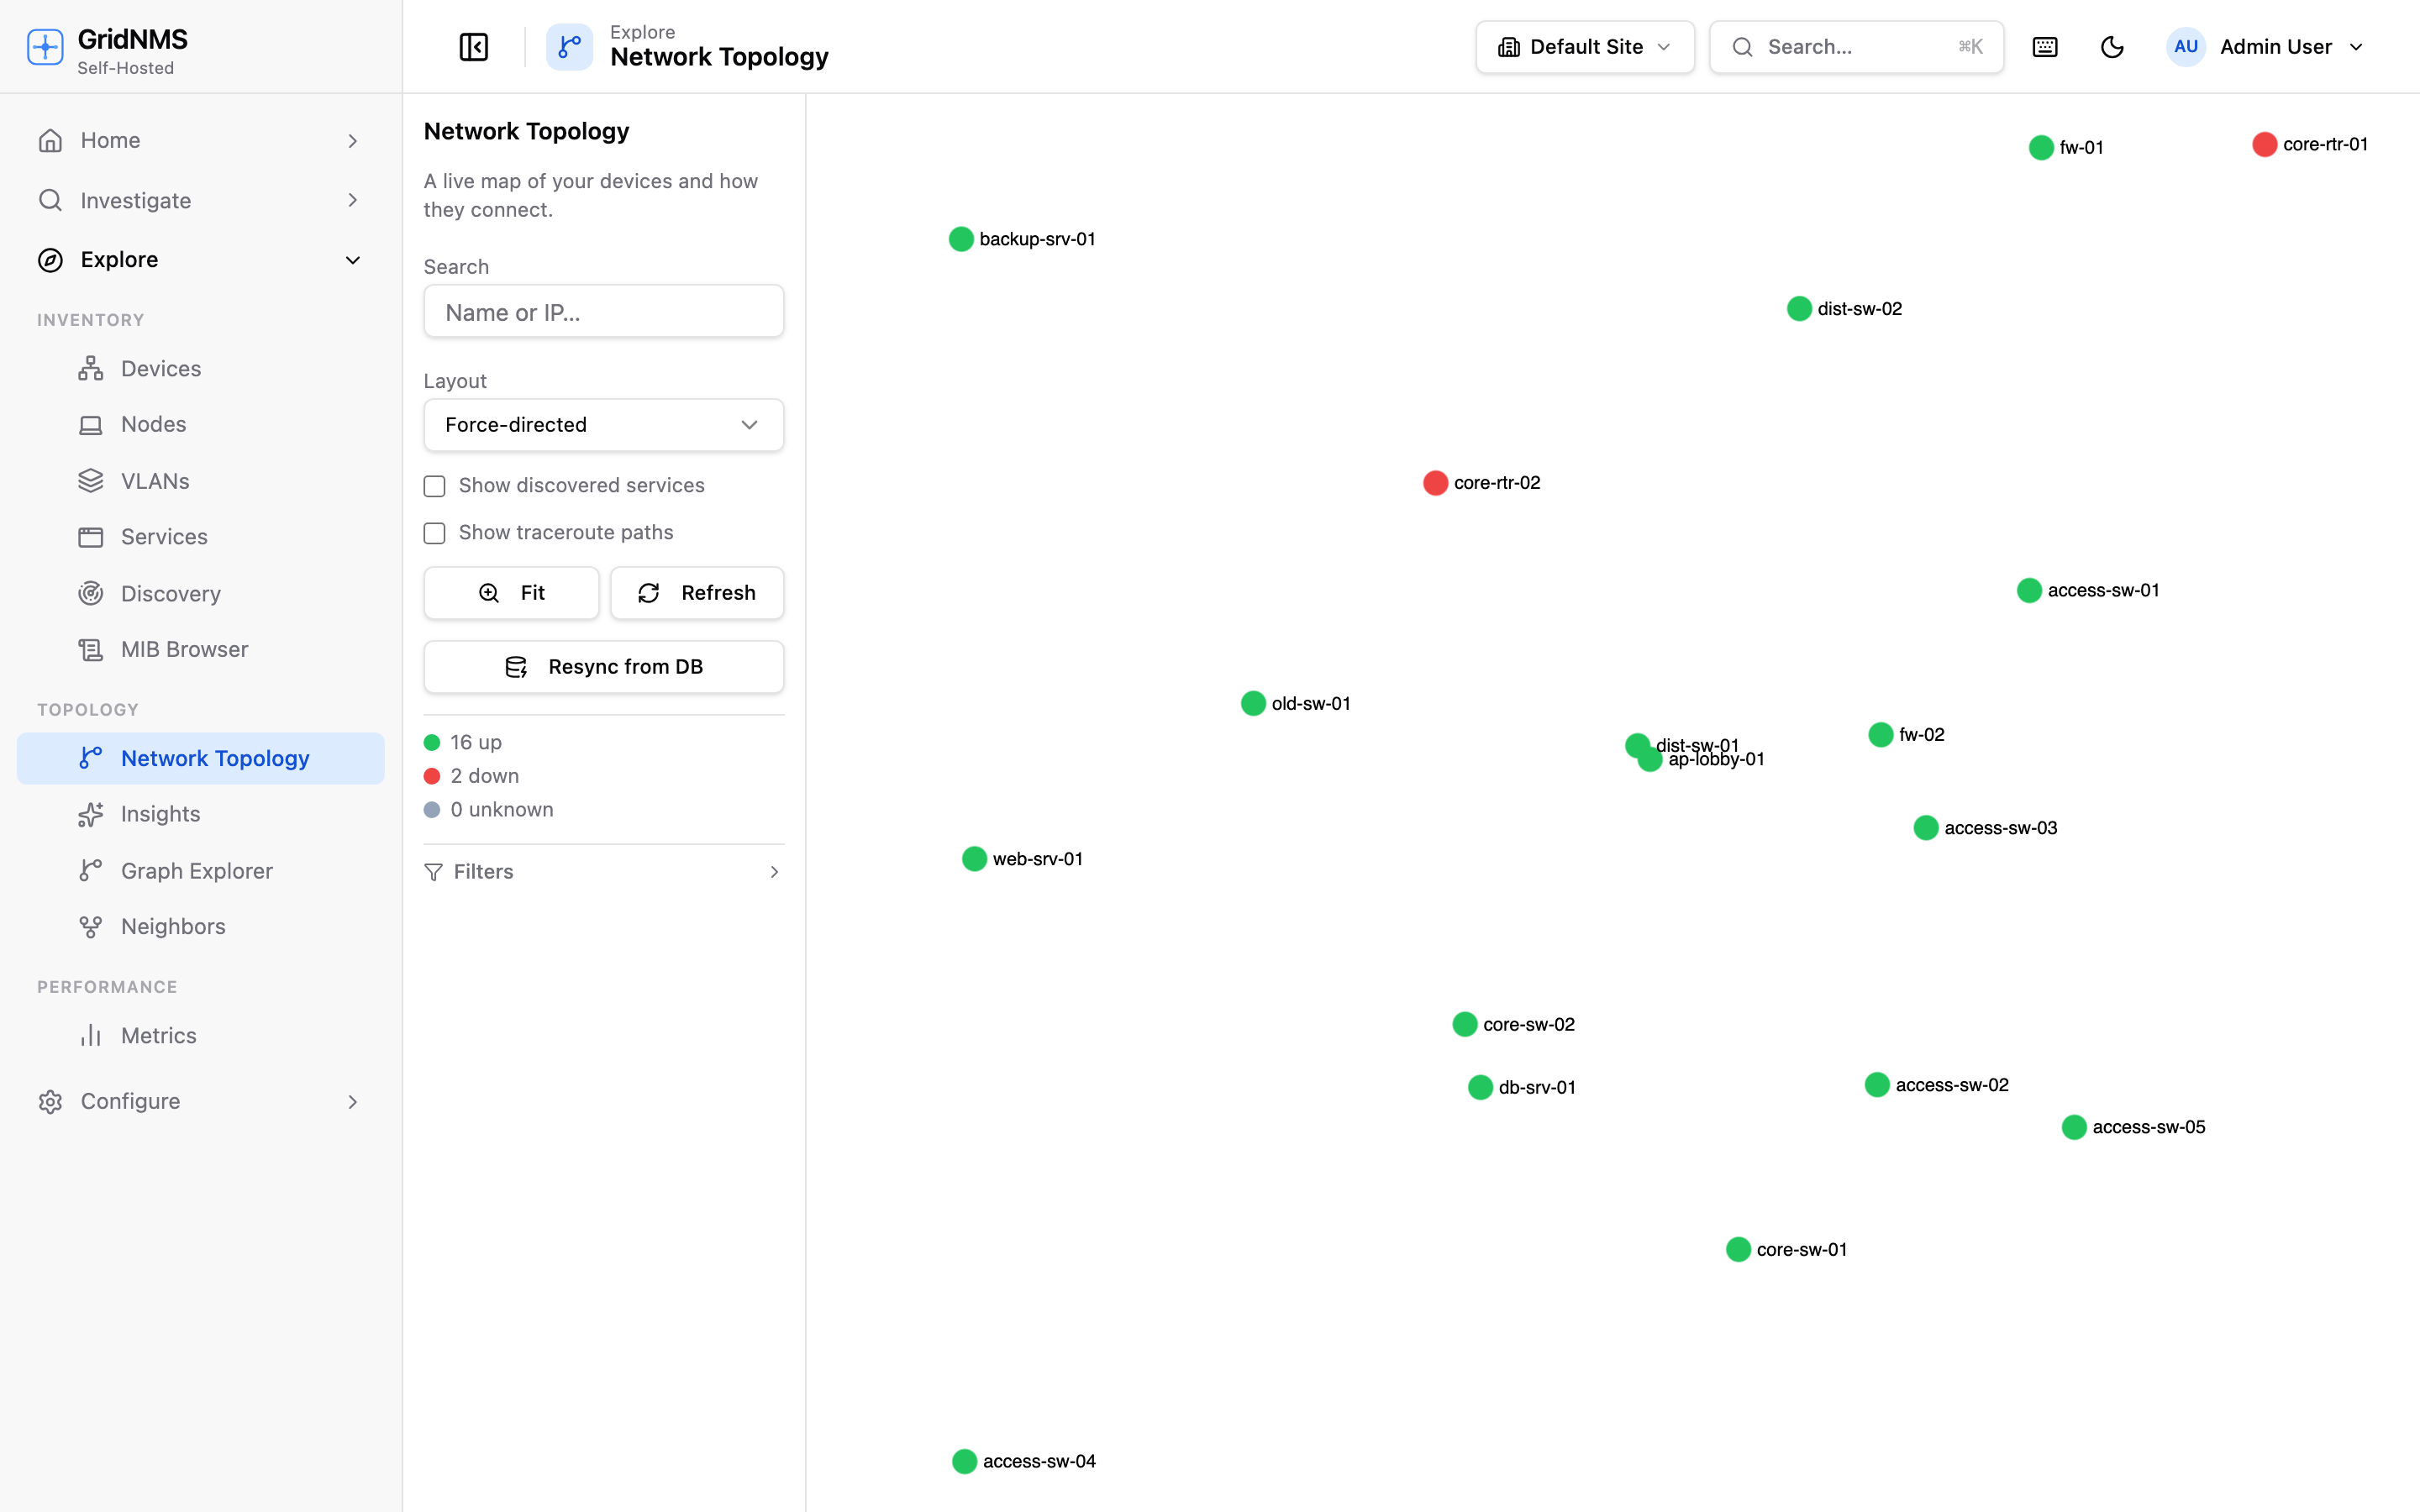 Graph Explorer, with devices colored by status.
Opening a view
Section titled “Opening a view”Open Graph Explorer and pick a starting point — a small set of ready-made queries that cover the questions people ask most:
| Starting point | Shows |
|---|---|
| Network Topology | Every device and the links between them. |
| Neighbors (LLDP/CDP) | The same device links, narrowed to physical connections GridNMS discovered automatically via LLDP or CDP — no manual cabling diagram required. |
| Applications exposed by a device | A device and the network applications it exposes. |
| Everything in a subnet | A network and the devices and hosts inside it. |
| Blast radius of a device | One device plus everything one hop away (links, interfaces, applications) — the “what else is affected” view. |
| Offline devices | Only devices currently down. |
| Devices by collector | Devices grouped by the collector watching them. |
Each starting point is just a query you can keep refining — add or narrow conditions, and re-run it, rather than being stuck with a fixed view.
Reading the map
Section titled “Reading the map”- Nodes are devices (and, depending on your query, interfaces, services, and other entities). Devices are colored by status: green for up, red for down, gray for unknown.
- Edges are the connections between them, labeled with the relationship
(for example
CONNECTS_TO). - Click a node to open its detail panel with the raw properties GridNMS knows about it.
- Fit to screen re-centers and zooms the map to show everything — handy after panning around or running a new query.
Filtering and narrowing a query
Section titled “Filtering and narrowing a query”Add conditions to any starting point to focus on what matters right now — device status, site, make, name, IP, and more, combined however you like. This is how you get from “show me the network” to “show me only the down access switches at the West site.”
Seeing exactly which port connects to which
Section titled “Seeing exactly which port connects to which”Discovered links tell you which devices are connected, but not which interface on each end — for that, include interfaces in your query so they appear as their own nodes (for example, extend a device query to also pull in its interfaces). Click an interface node to see its name and status in the detail panel — this is how you confirm a cable goes where the documentation says it does, or trace which uplink a closet switch uses.
Sharing a view
Section titled “Sharing a view”The query you build is part of the page’s address. Once the map shows what you want, the browser’s URL already describes it — copy it out of the address bar and send it to a colleague, or bookmark it. Opening that link rebuilds the same query and shows the same results, not just an empty builder.
Back and Forward work the way you’d expect too: they step through the queries you ran, so you can back out of an exploration without rebuilding what you had a minute ago. Reloading the page keeps the view rather than resetting it.
Blast radius: what else is affected
Section titled “Blast radius: what else is affected”Before a planned change, or during an outage, start from Blast radius of a device to see everything directly connected to the device in question — the quickest way to spot what else is at risk before you touch anything.
Where to go next
Section titled “Where to go next”- Drill into any device from the map via Devices & Inventory.
- Discover new devices to add to the map with Network Discovery.
- See every discovered application across your whole network, not just one device at a time, in Applications.
- Investigate events on a connected device in Events & Alerts.
docs built 2026-09-26 · 195c6d00