
Service Monitoring
A device being reachable doesn’t mean the services that depend on it are working. Service Monitoring lets you model a business or infrastructure service as a graph of the pieces it’s actually built from, wire those pieces together with real dependencies, and let GridNMS work out the service’s overall health for you — instead of you eyeballing a dozen device and check statuses and doing the math in your head every time something looks off.
Where to find it
Section titled “Where to find it”Open Explore → Service Monitoring. There are five tabs:
- Services — the services you’ve modeled, each with its own health.
- Monitors — the active checks you can attach to a component (see Monitors below).
- Components — the building blocks those services are made from.
- Proposals — suggestions GridNMS found while scanning your network (see Proposals below), with a badge showing how many are waiting.
- Settings — tenant-wide behavior for Service Monitoring (see Threshold clearing below).
Services and components
Section titled “Services and components”A Service is the thing you actually care about — “Customer Portal,” “Internet Access at the Denver office,” “Payment Processing.” It has a name, a description, an optional owner, team, and tier for your own bookkeeping, and it can be scoped tenant-wide or to a single site.
A Service doesn’t check anything on its own. It’s built out of Components — the pieces underneath it — and each Component can be:
- A managed device — one of the devices you already monitor.
- A discovered application — a service GridNMS found running on a host while scanning your network, like a web server or database port.
- An endpoint — a plain IP address you type in, for something outside your managed inventory.
- A monitor you attach right there — creates a check and a component for it in one step (see Monitors below).
- Just a label for grouping — a component with nothing attached, used purely to organize other components underneath it (for example, grouping “Web,” “API,” and “Database” components under a “Backend” node).
A Component can itself have components under it, so you end up with a real graph, not a flat list: a “Customer Portal” service depending on a “Web” component, which depends on an “API” component, which depends on a “Database” component, which is anchored to the actual database device.
Wiring dependencies
Section titled “Wiring dependencies”Every edge in the graph — service to component, or component to component — is marked hard or soft:
- Hard — if this component goes down, whatever it feeds goes down with it.
- Soft — if this component goes down, whatever it feeds only degrades. It never takes the parent all the way down on its own.
This is what makes the model useful: not everything underneath a service is equally critical. A cache being down might slow a service noticeably (soft) without making it stop working; a database being down definitely takes the service with it (hard).
How health rolls up
Section titled “How health rolls up”Every Service and Component reports one of four states: up, degraded,
down, or unknown. unknown never quietly reads as up — if GridNMS can’t
tell a component’s status (its collector is offline, say), that uncertainty
propagates up rather than getting hidden.
A Service or Component with children combines their states using a rollup policy, set per node:
| Policy | Behavior |
|---|---|
| worst (default) | Takes the worst state among its children. |
| any | Goes down as soon as any one child is down. |
| all | Goes down only once every child is down; otherwise it’s degraded. |
| n_of_m | Goes down once a threshold number of children are down (you set the threshold — the field is labeled Threshold (N of M children down → Service down)); below that, it’s degraded rather than hidden. |
A down child on a soft edge is folded down to degraded before it’s rolled
up — it can pull its parent to degraded, never all the way to down, no matter
which rollup policy is in effect. A down child on a hard edge rolls up as-is.
Because the graph is real — not a diagram someone drew and forgot to update — you can trace from any degraded component up through everything that depends on it, or down through everything it depends on, and see exactly what’s affected and whether the path is hard or soft. That’s the payoff of modeling the service instead of just watching a pile of unrelated checks: one failure’s blast radius is right there in the graph, not something you have to reconstruct from memory.
What feeds a component’s health
Section titled “What feeds a component’s health”A Component’s own health — before any rollup — comes from whatever’s attached to it, and it’s the worst of the two:
Monitors (active checks)
Section titled “Monitors (active checks)”A device being reachable doesn’t mean the service running on it is actually working. A web server can answer pings while its login page returns errors; a mail relay can be up while it refuses connections. Monitors are active checks — sometimes called synthetic or uptime checks — that reach out to a service on a schedule, confirm it responds correctly, and record how long it took.
Every check runs from one of your own collectors, not from an outside service somewhere on the internet. That means you can monitor internal services — an intranet app, an internal DNS server, a mail relay, a file share — that a public uptime tool could never reach, right alongside internet-facing endpoints, all in the same list.
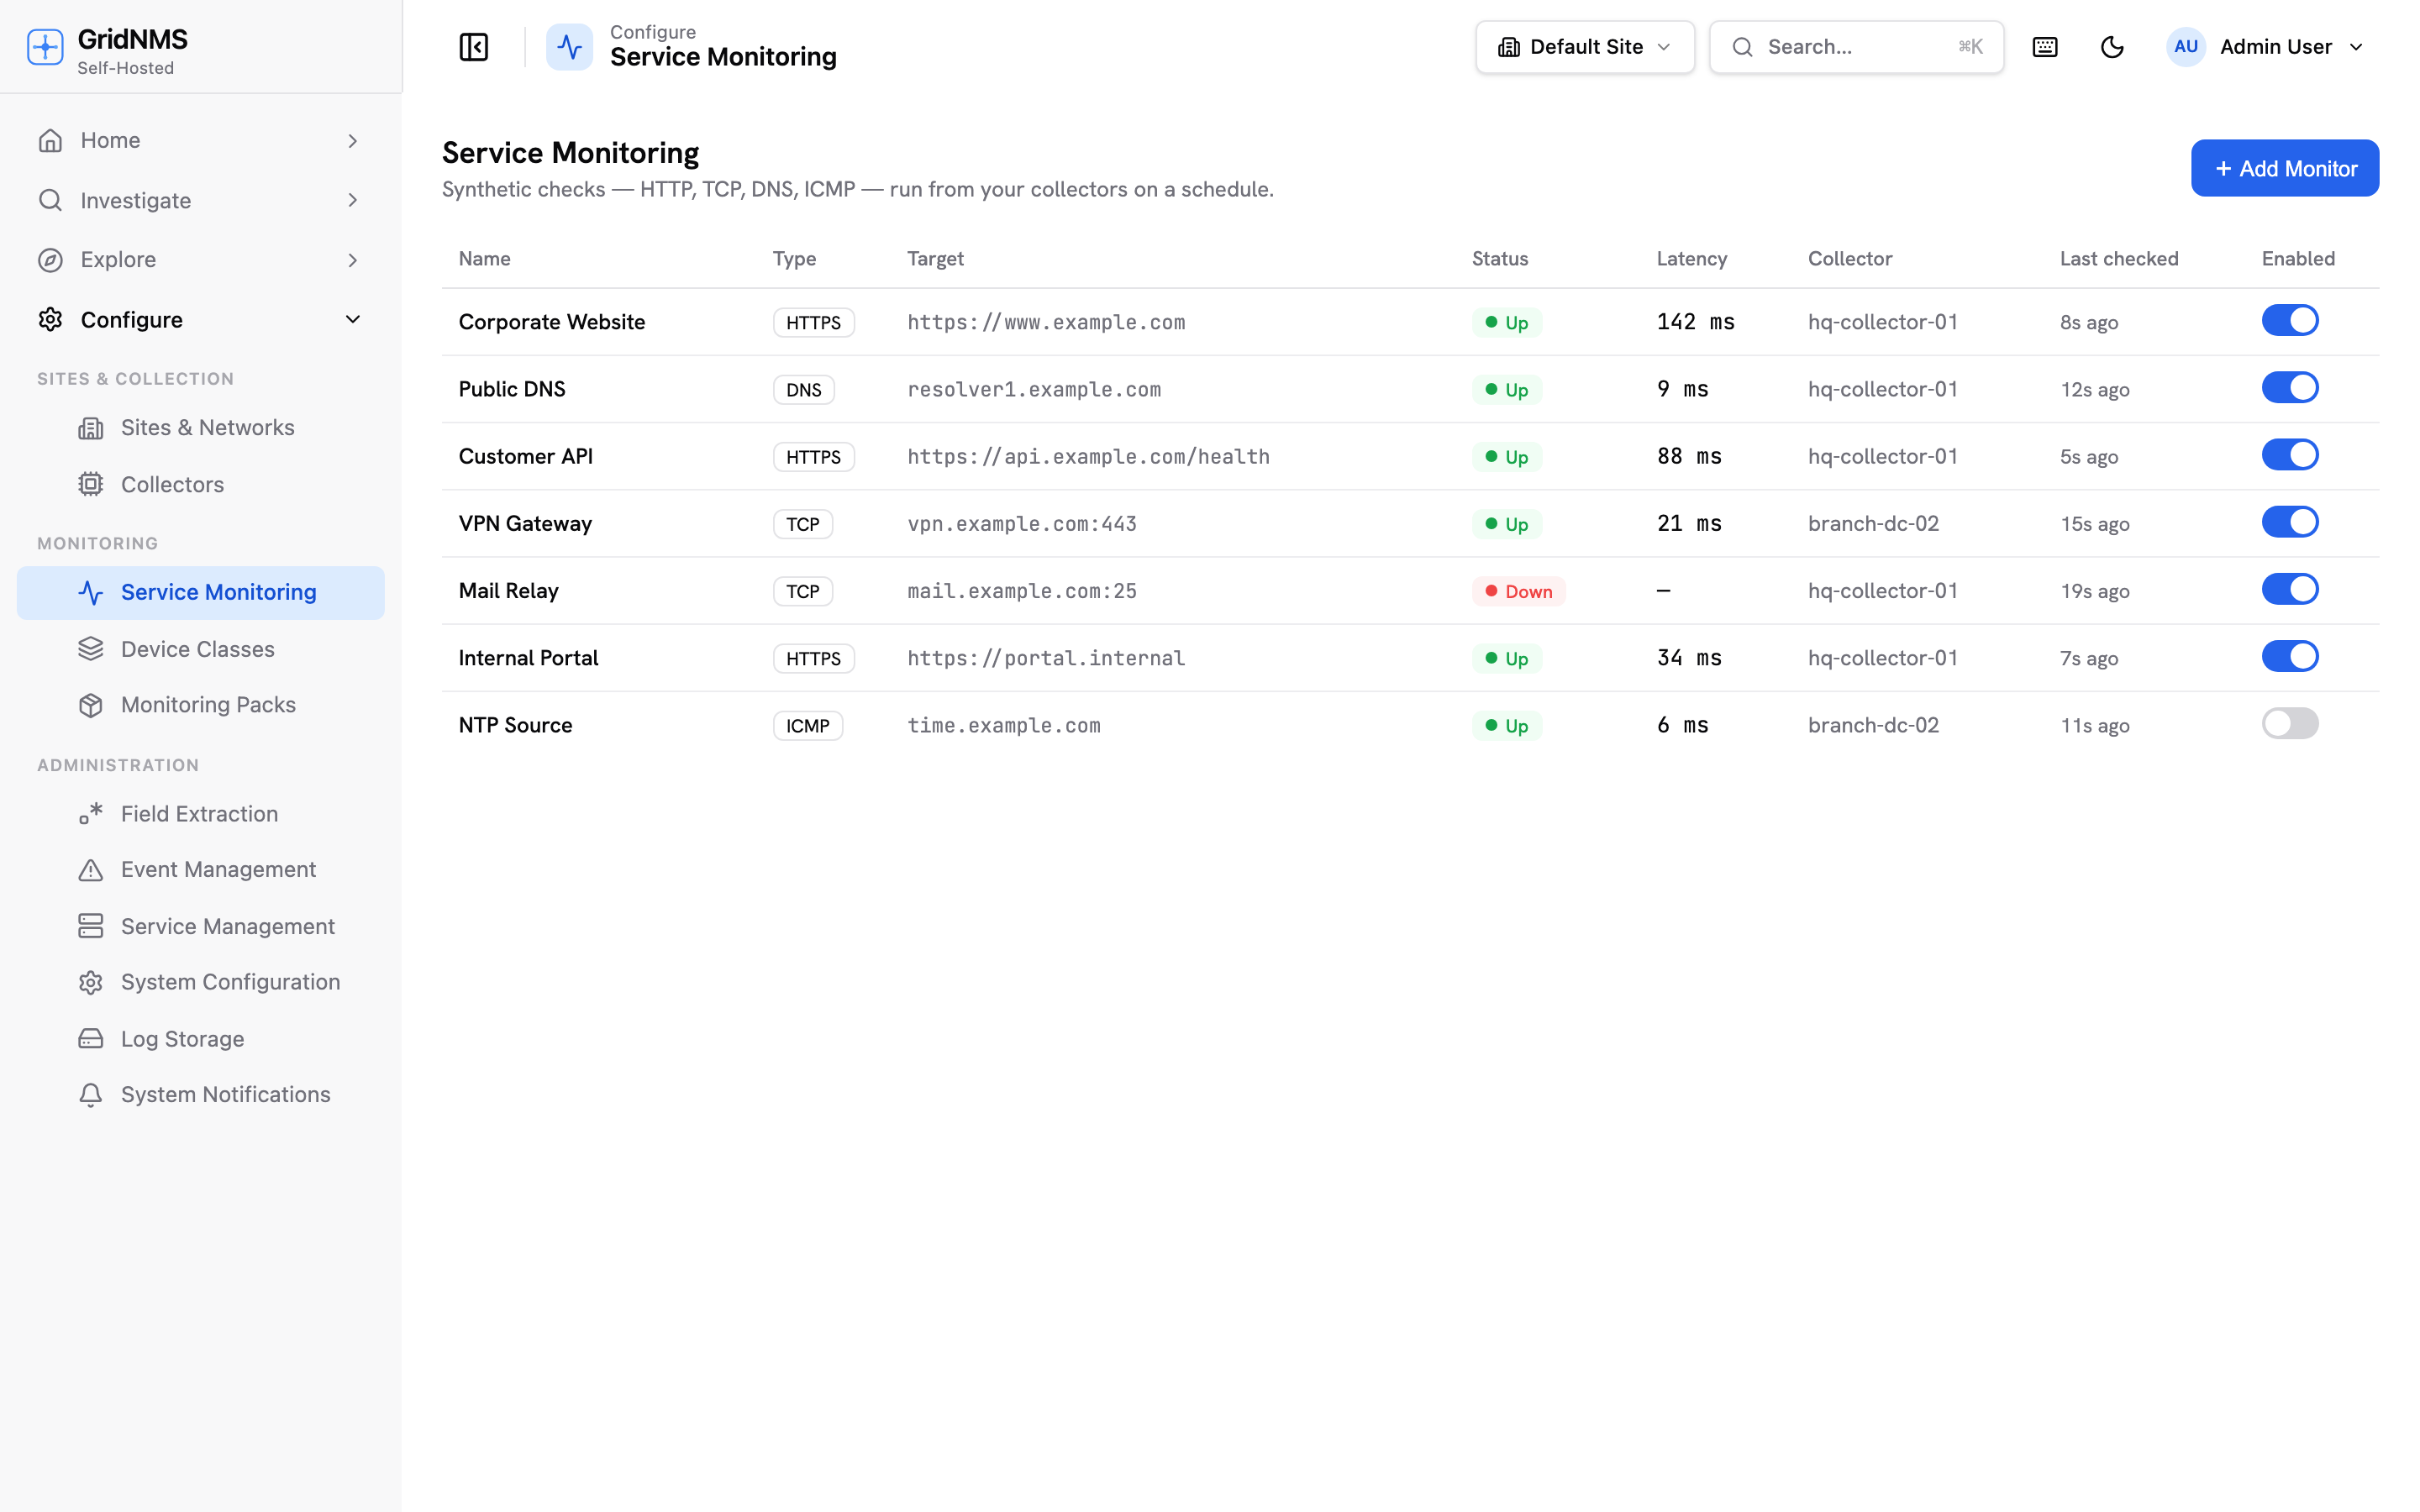 The Monitors tab lists each check with its type, target, current status, and latest response time.
How this differs from device reachability
Section titled “How this differs from device reachability”GridNMS already tells you whether a device is up — see Devices & Inventory. That check answers “is the box on the network?” A monitor answers a different, more useful question:
| Device reachability | A monitor | |
|---|---|---|
| What it checks | The device responds on the network | A specific service answers correctly |
| Example | The web server replies to a ping | https://app/health returns OK in under 500 ms |
| Catches | Hardware down, link cut, device offline | App crashed, port closed, cert/DNS broken, service slow |
Use both together: reachability for the device, a monitor for each service that device exposes that you actually care about.
Creating a check
Section titled “Creating a check”From the Monitors tab, click Add monitor — this opens a step-by-step guided setup, walking through one decision at a time rather than one long form. A vertical list on the left shows every step; you can jump back to any step you’ve already been through.
-
Name and check type — give the check a label you’ll recognize (e.g. Web app — login page), then pick what kind of service you’re testing:
Type What it verifies HTTP A web endpoint responds. Optionally give a full URL (otherwise it’s built from the host) and a keyword that must appear in the response body. TCP A specific TCP port accepts a connection — for services with no application-level check of their own. ICMP A simple ping, for when you want a service-style check (with its own thresholds and severity) rather than device reachability. DNS A name resolves. Pick the record type (A, AAAA, CNAME, MX, TXT, NS). Certificate lifecycle Connects over TLS and watches the certificate for upcoming expiry. Database Runs a read-only query against a database and checks it returns the expected result — see Database checks below; picking this type routes to its own two extra steps before rejoining the flow here. Transaction Runs a bounded sequence of HTTP steps, chaining data between them. SMTP A mail server accepts a connection. SMB A Windows/file-sharing service answers. UDP A best-effort check that a UDP port is open. UDP has no handshake, so silence is treated as up — only a reply or a rejection is a definitive down. -
Target — choose Managed device to pick one of your existing devices from the list, or Hostname / URL to type any address — internal or internet-facing. A hostname target is looked up fresh on every check, so monitoring keeps working even if its IP changes. If the device you pick has more than one configured address — its primary IP, any additional addresses, or an external hostname — you choose which one this check monitors from a drop-down, and can come back and change it later (see Editing a monitor’s target below). Port isn’t needed for ICMP; for TCP and UDP it’s required, and for the other types you can leave it blank to use the default for the check type.
-
Where it runs — pick the site, then the collector that runs this check. A monitor always runs from a collector, not from the GridNMS server, so it’s performed from inside the relevant network. GridNMS offers the collector(s) eligible to reach the target, and picks one automatically when the target sits inside a named network — or choose Auto (per site) to let GridNMS pick whichever collector covers it, now or later. You can also run the same check from additional collectors here and require a quorum of them to agree before calling it down (multi-vantage), so one collector’s own local network trouble doesn’t read as a false alarm. The quorum governs recovery the same way: the check only reads healthy again once enough vantage points agree, so one collector regaining its path doesn’t clear an outage the others can still see. Set the check interval here too — how often the check runs, from every 10 seconds up (for example,
60for once a minute). Shorter intervals notice an outage sooner but run more often. -
Thresholds & alerts — set Warn and Critical latency (optional response-time thresholds — a successful check slower than either one reports as degraded even though the service technically answered) and a down-event severity (Critical, Major, Minor, Warning, or Info).
-
Review — check the summary, then click Create monitor.
-
Add to a service (optional) — after the monitor is created, you can immediately create a new component for it (optionally placing that component on an existing or brand-new service too) or attach it to an existing component. Skip for now is the default — you can always attach a monitor to a component later from its row.
If the collector running a check goes away
Section titled “If the collector running a check goes away”Checks follow the same collector assignment rules your devices do, so a collector going offline doesn’t leave its checks silently stranded. When a collector stops reporting, GridNMS re-homes its checks onto another healthy collector that can reach the same targets, and they carry on running.
If no healthy collector can reach a target, the check goes unknown — never
down. That distinction is deliberate: a collector being dark means GridNMS has
stopped receiving evidence, not that the service failed. Reporting down there
would page someone for an outage that may not exist, and would mask the real
problem, which is the collector. The check recovers on its own the next time a
collector can run it.
Database checks
Section titled “Database checks”Picking the Database check type routes you through two extra steps before rejoining the target/site/thresholds flow above:
- Engine — choose which database you’re connecting to: PostgreSQL, MySQL-compatible (MySQL, MariaDB, Percona, Aurora MySQL, TiDB), Microsoft SQL Server / Azure SQL, or Oracle Database. This decides the next step’s default port and a couple of its labels.
- Database fields — the target (device or hostname) and port, pre-filled with the engine’s usual port (5432, 3306, 1433, or 1521), then the database name (for Oracle, the service name), the query, optional username/password, and a TLS toggle. Add one or more result assertions (a row count, or a specific column’s value) if a successful connection and query alone aren’t enough — otherwise the check only asserts that the query runs successfully.
Only a bounded number of result rows is ever read. For PostgreSQL, MySQL-compatible, and Oracle databases, the query always runs inside a read-only transaction, so it can never modify data; for SQL Server, any change the query makes is always undone and never saved — though we recommend using a read-only database account for this check on every engine.
Reading the results
Section titled “Reading the results”Each row shows a status and the latest latency:
| Status | Meaning |
|---|---|
| up | The service responded correctly within thresholds. |
| degraded | It responded, but slower than your Warn threshold. |
| down | It failed to respond, returned the wrong result, or the keyword was missing. |
| unknown | The check hasn’t run yet, or no healthy collector can currently run it. |
Latency is the round-trip time of the last check, in milliseconds — a steady number means a healthy service; a rising trend is an early warning that something is getting slower before it breaks.
Click any row to open its detail panel. You get the full configuration at a glance plus a latency chart over a time range you choose, so you can see how response time has trended — useful for spotting a service that’s been slowly degrading or for confirming an outage window. The Last error field shows why the most recent check failed, if it did.
Use the pencil icon on a row to edit a monitor — you can change the name, interval, thresholds, severity, HTTP/DNS options, and which collector runs it. The check type, and which device or hostname it’s anchored to, are fixed; to change those, delete the check and create a new one. Use the Enabled toggle to pause a check without deleting it — handy during planned maintenance so you don’t get alerted for an outage you already know about. Use the trash icon to remove a check entirely.
Editing a monitor’s target
Section titled “Editing a monitor’s target”A check anchored to a managed device follows one of that device’s configured addresses — its primary IP, an additional address, or its external hostname. Open the pencil icon and use the Address to monitor drop-down to switch which one it follows; a check anchored to a hostname/URL can have that address edited directly. If the address you pick sits outside every network a collector is assigned to reach, saving is refused with an explanation rather than silently accepting a target nothing can ever check.
If you update a device’s primary IP address on its own detail page, every monitor that follows that device’s IP updates automatically to match, and you’re told which ones changed. A monitor deliberately pointed at a different address on the same device is left alone.
Metric Signals
Section titled “Metric Signals”A Metric Signal attaches a threshold to a metric you’re already collecting — no new check to run, no new collector traffic. On a component, open Metric Signals and add one:
- Source — where the metric comes from: System, Interface, or Container.
- Metric — the specific measurement, e.g. CPU utilization or interface errors.
- Condition — greater than, at least, less than, or at most.
- Threshold value — the number that trips it.
When the metric crosses the threshold, the component’s health reflects the breach exactly the way a failing monitor would — GridNMS takes the worse of the two when it computes the component’s own status.
Threshold clearing
Section titled “Threshold clearing”A metric that sits right at its threshold can flip between breached and cleared on every single check — one alert after another for what is really one ongoing problem. Under Settings, Cleared samples before clearing a threshold sets how many checks in a row need to come back under the line before a metric signal’s threshold actually clears. It defaults to 3.
This only changes how a breach clears — a breach is still reported the moment the first check goes over the line, and while a threshold is waiting to clear it still shows as breached. Any single check that goes back over the line resets the count, so a threshold only clears once it’s been genuinely quiet for that many checks in a row.
This setting applies to metric signals only. Device reachability and active monitor checks (the Monitors tab) always clear on the first good check.
Proposals
Section titled “Proposals”As GridNMS scans your network, it can spot topology you haven’t modeled yet — without ever changing anything on its own. Two kinds of suggestions show up in the Proposals tab:
- New component — a discovered host is exposing a service no component covers yet, like “db-01 now exposes 6379/redis.” Accepting it asks you to name the component and attach it to a service.
- Dependency edge — GridNMS has observed a real connection between two components that are already in your services but not linked to each other. Accepting it adds the dependency (hard or soft).
You can also dismiss a suggestion — GridNMS won’t propose it again. Nothing here is applied automatically; every suggestion waits for you to review it.
Viewing a service
Section titled “Viewing a service”Every Service has three views, and they share one time range with the rest of Service Monitoring — pick “Last 24 Hours” anywhere under Service Monitoring and it stays picked as you move between the service list, a monitor’s detail, and a service’s own views, instead of resetting to the default on every navigation.
- Graph — the dependency graph itself: every component, wired by hard and soft edges, colored by current health. Click any component to see its detail and a status timeline, and expand one of its checks to get that check’s own latency chart right there — so you can tell a service that failed outright from one that had been slowing down for an hour first, without leaving the graph. A check with no measurements yet says so rather than showing an empty chart. This is the view for tracing a failure’s blast radius.
- Tree — the same structure, laid out hierarchically instead of as a graph.
- Events — everything that’s happened to this service, in order.
Seeing what happened, not just what’s happening now
Section titled “Seeing what happened, not just what’s happening now”A component that went down and recovered inside the range you’re looking at used to look identical to one that had been healthy the whole time. Now every node in the graph is flagged with what happened during the window — “2 down in range”, “1 degraded in range” — with a coloured edge marker beside it, even when that component is perfectly healthy right now. That’s the difference between “nothing to see here” and “this dropped out twice overnight and recovered on its own,” which is usually the thing actually worth chasing.
Why was it red? The evidence drawer
Section titled “Why was it red? The evidence drawer”Every service and component carries a status timeline: a strip of coloured segments, one per slice of the range you’ve selected. Click any red or amber segment — on the header strip, or on a component’s own row — and an evidence drawer slides out on the same page, answering what was failing, and why, for exactly that slice:
- What happened here — the service and component involved, the state it went
from and to, and the cause GridNMS traced it to: the monitor that failed,
its check type and target, the reason it reported (for example
HTTPS 502 Bad Gateway), the response latency, and which collector — the vantage — observed it. When the cause was a metric threshold or an unreachable device rather than a check, it names that instead. - Events in this window — every event raised for the service during that slice.
- Check history — the individual results behind the failing monitor’s red run, each with its status, response time, HTTP status code where there is one, and the detail the check itself returned. This is the per-attempt record: it’s what tells you whether a service failed outright or flapped in and out.
The open drawer is part of the page’s address, so refresh, back and forward all restore it, and Open full page gives you a link you can send to whoever needs to look at the same slice.
If a segment is red because an outage was already under way before that slice began — nothing transitioned inside it — the drawer still shows you the transition that caused it, rather than coming up empty.
Service-level objectives
Section titled “Service-level objectives”A service can carry an availability target — the share of time it’s expected to be up over a rolling window — so you can answer “are we meeting what we promised?” without adding it up by hand, and hear about trouble while there’s still time to act rather than after the month is already blown.
Turn it on when you create or edit a Service: switch on Service-level objective, then set
- Target (%) — the availability you’re committing to, for example
99.9. - Rolling window (days) — how far back the calculation looks, from 1 to 90 days.
Both are off by default, and a service without an objective behaves exactly as it did before.
Once one is set, that service’s Graph view gains an SLO card:
| Attainment | The share of the window the service was actually up. Reads Not enough data yet until there’s history to measure against. |
| Error budget remaining | How much of the allowed downtime is still available. Turns amber below 25%, and red once you’ve spent more than the target allows. |
| Burn rate (5m/1h) | How fast you’re spending that budget right now, over a short and a longer look-back. 1x is exactly the pace the target permits; 10x means that if it kept up you’d exhaust the whole window’s budget ten times over. |
The two burn rates are shown together deliberately. The short one reacts to a sharp outage within minutes; the longer one confirms it’s a sustained problem rather than a blip — so a brief hiccup doesn’t read the same as a service that has been quietly failing for an hour.
If your window is longer than the history collected so far, the card says which portion of it the number is based on, instead of quietly reporting a figure drawn from a partial window.
Getting alerted
Section titled “Getting alerted”A confirmed change in status — a real transition, not a single blip — raises an event in GridNMS, attributed to both the service and the component that changed, exactly like any other alert. When you create or edit a monitor you set its down-event severity (Critical, Major, Minor, Warning, or Info), which controls how prominently the failure shows up.
From there it flows through your alerting like everything else: the event appears on the Events & Alerts page and is delivered to the right people through your Notifications setup. So you can, for example, have a critical web-app component page on-call while a minor internal one only sends email.
The alert names what broke
Section titled “The alert names what broke”A service alert doesn’t just tell you a detection fired — it carries the cause GridNMS traced, so the notification on its own is usually enough to decide whether to get out of bed:
[GridNMS] Website — DOWN (Web frontend: HTTPS 502 Bad Gateway)
Service:    WebsiteComponent:  Web frontendImpact:     DOWN (was up)Cause:      Web frontend — HTTP check of https://www.example.com/Reason:     HTTPS 502 Bad GatewayLatency:    1,204 ms   Vantage: denver-collector (collector 3)Severity:   Critical
A recovery says what came back and to which state. The same detail appears on the event itself, so the Events & Alerts list reads Managed Service “Website” — component “Web frontend” is DOWN — Web frontend: HTTPS 502 Bad Gateway rather than a bare detection name.
When several related events are grouped into a Case, the Case carries the same detail: its title names the service and the component, and its notification explains the cause instead of repeating the rule’s name.
Where to go next
Section titled “Where to go next”- Decide who gets told, and how, in Notifications.
- Triage the failures these services and checks raise on Events & Alerts.
- See how discovered applications become component anchors in Network Discovery.
- Understand the difference between device and service health in Devices & Inventory.
docs built 2026-09-26 · 195c6d00